Nagios Network Analyzer collects NetFlow, sFlow, jFlow, and IPFIX from the devices you already run, so you can see which Hosts and ports are taking the bandwidth. Extend with Suricata for signature-based intrusion detection, Nmap for discovery, and Wireshark for packet capture.
Free 30-day trial with the full feature set. Installs on your own server, on premises.

Trusted by 10K+ Teams Worldwide


A Host check tells you an interface is reachable. Nagios Network Analyzer tells you what crossed it, what the packets contained, and what else is listening on the segment.

Every flow record carries the IP addresses and ports on both ends, so a bandwidth spike resolves to named endpoints rather than a busy interface.

Break traffic down by protocol and port, then capture packets on an interface when the flow summary does not settle the question.

Scheduled Nmap scans record the Hosts and open ports on a segment, and an Ndiff shows what changed since the last scan.
Rank the endpoints taking the link, then select a value to jump straight to the Queries tab with the filter already applied. Utilization resolves to a device, not an interface total.
Resolve an unfamiliar address from the top talkers table without leaving the page.
Splits the total by address, port, and protocol, which is what names the source of a spike. This is what Network Analyzer does.
Reads a counter on the device for one total per interface. SNMP bandwidth monitoring in Nagios XI covers this if a per-interface total is all you need.

Nagios Network Analyzer is a NetFlow monitoring tool that collects NetFlow, sFlow, jFlow, and IPFIX on one server. Each Source binds to a port, writes flow data to its own directory, and holds it for a lifetime you set. Point routers, switches, firewalls, and Linux or Windows servers at that port and data starts arriving.

Build a filter in Nfdump syntax, save it as a Source Query, and reload it instead of retyping it.

Retain the exact historical flow data you need, from any source, for extended analysis.

Granular flow files expire on the lifetime you set. Aggregated bandwidth history stays.
You write queries in Nfdump syntax, so the filtering will be familiar if you have run a collector before. What Nagios Network Analyzer adds is everything around that query, and it is all in the base install, whether or not you add the packet capture and discovery tools.
Bandwidth and saved queries compare against Warning and Critical thresholds every five minutes, then deliver to Nagios XI, Fusion or Nagios Core over NRDP, SNMP traps, email, Slack, or a custom command.
A Source's data lifetime starts at 24 hours. Traffic Profiles extend retention for the subsets that matter instead of raising the lifetime, and the disk cost, for everything.
Roles template access to Sources and Groups, then apply to new and existing users. Local accounts, or Active Directory and LDAP with SSL/TLS by default.
Nagios Network Analyzer runs traceroutes that show every hop between an origin and a target with the latency at each one, which tells you whether the problem is local or several networks away.
Schedule them and compare recent runs in a dedicated dashlet, so you can watch a path degrade instead of hearing about it in a ticket.
Extend traffic and security analysis beyond flow data. The onboarding, integration, and interfaces for Nmap, Wireshark, and Suricata are built in, at one core and 2 GB RAM each.
A flow record says what and how much. A packet capture says exactly what was sent.
Suricata compares traffic against signature rules and records every match as an alert.
Flow data shows the devices that are talking. Nmap finds the ones that are listening.
Suricata reports traffic matching a signature rule you enabled. Nmap reports the ports and Hosts that answered a scan. Both produce findings for a person or an upstream check to act on.
Nagios Network Analyzer runs checks every five minutes and compares each result against Warning and Critical thresholds you set, then sends the result as a passive check into Nagios XI or Nagios Core over NRDP.

Threshold bandwidth or a saved query on a Source, Group, or Traffic Profile.

Alert on the presence of chosen Signature IDs over a lookback period you define.

Alert on the number of open or closed ports found by a scheduled scan.

Watch the collector itself: CPU, memory, root drive usage, and job worker availability.
Any dashboard downloads on demand or schedules out as a PDF or JPG. Configure delivery schedules and recipient lists, edit or toggle active reports on the fly, and review delivery history with retention you set.
Area, bar, line, pie, and radial charts plus data tables and a traceroute topology, covering bytes, flows, packets, bits per second, top talkers, and scheduled Nmap scan results.
Move a dashboard between servers or clone one as the starting point for the next.
Nagios Network Analyzer runs as its own server. Link it to Nagios XI with an API key and the two work in both directions: XI polls Network Analyzer, and Network Analyzer answers back.
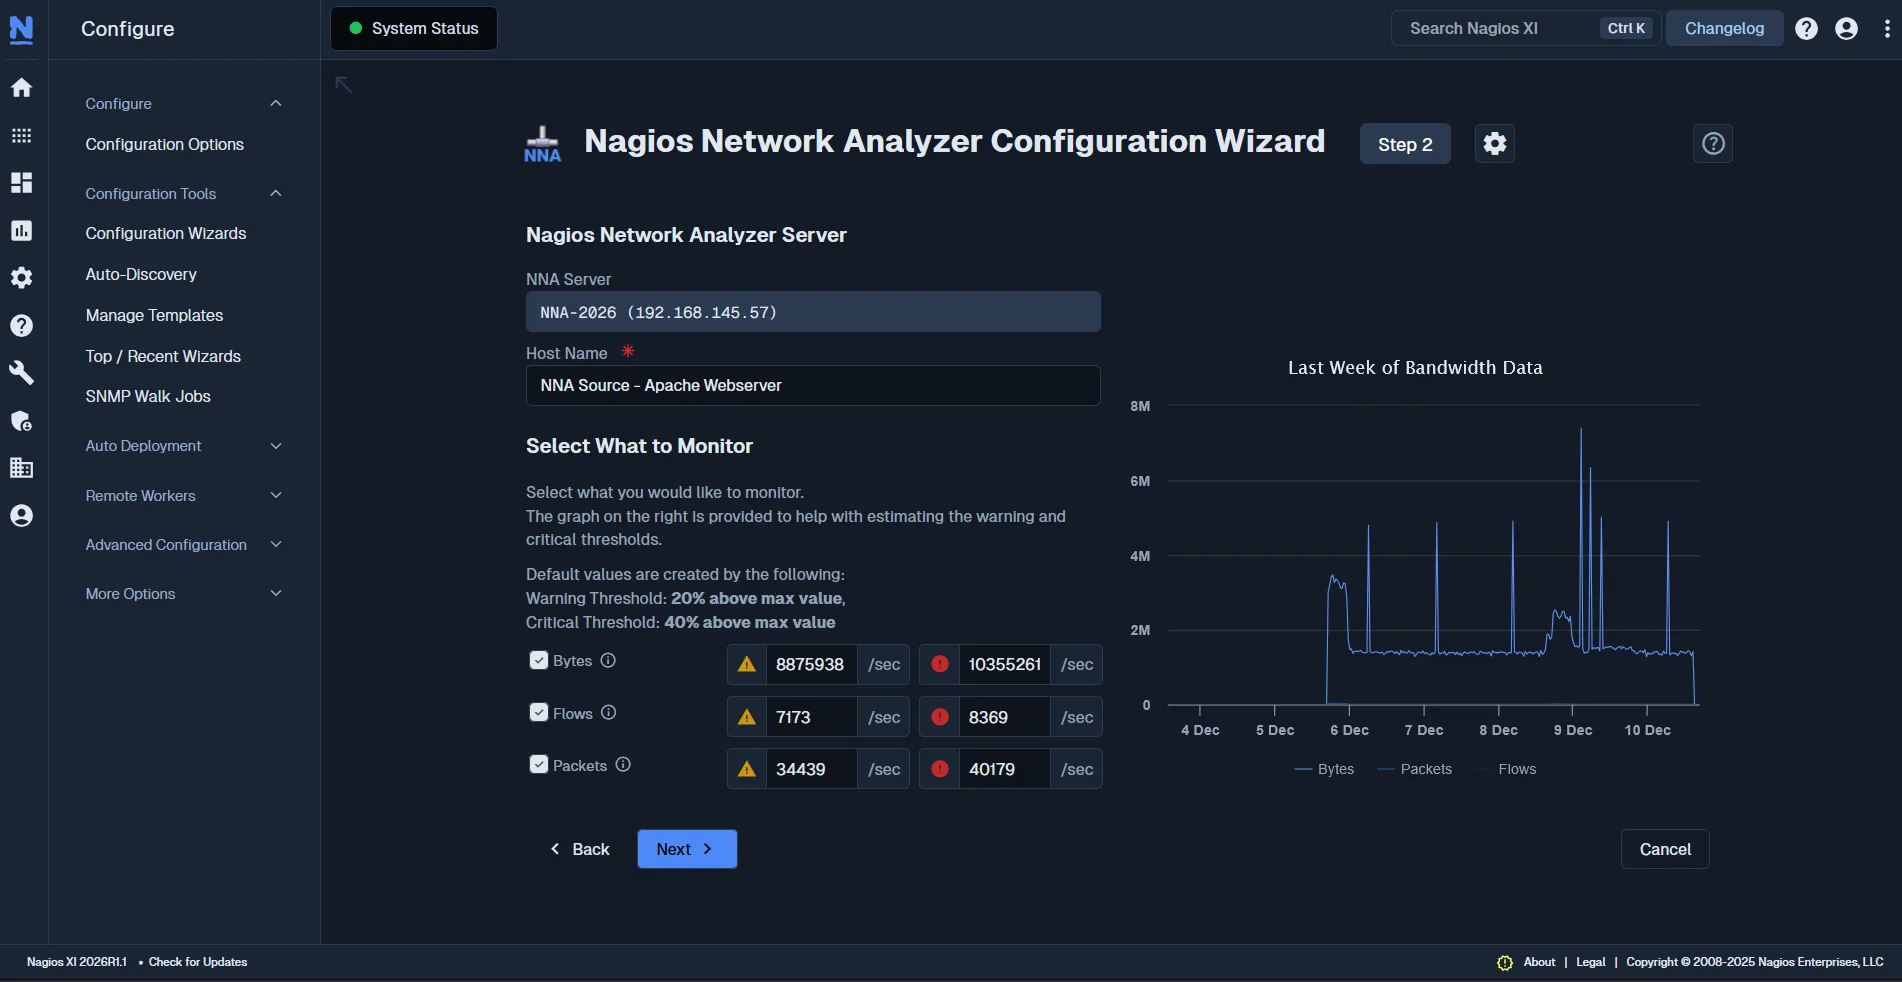
The Network Analyzer Wizard under Configure > Configuration Wizards builds the checks for you, so a Source or Source Group gets polled like any other Host.
Results arrive over NRDP as passive checks, so a saturated link shows up in the same queue as a dead disk, on the same dashboards and escalations.
Network Report and Network Query Report join the XI Reports menu, and a Network Traffic Analysis tab lands on Host and Service detail, so the traffic answer is one click from the alert.
Nagios Network Analyzer installs on your own server, on premises. Template access per team with Roles, authenticate against Active Directory or LDAP, and size the server for what you actually install.
| Requirement | Specification |
|---|---|
| Operating systems | RHEL, CentOS, and Oracle Linux 9 and 10. Debian 12 and 13. Ubuntu 24. Exact supported releases across every product are listed in the OS compatibility matrix. |
| Processor and memory | The system requirements are 1 core and 2 GB RAM per integration as a minimum, 2 cores and 4 GB recommended. A base install collecting flow data counts as one. Wireshark, Suricata, and Nmap each add one. |
| Storage | 128 GB free minimum, 1 TB recommended. Actual use tracks flow volume and the Raw Data Lifetime set on each Source, which the backend documentation explains. |
| Exporters | Routers, switches, firewalls, and Linux or Windows servers configured to send flow data to a Source port. |
Full documentation in the Nagios Network Analyzer Administrator Guide.
A Role templates access to flow Sources and Groups, Traceroutes, Reports, Wireshark, Nmap, and Suricata, then applies to new and existing users. Admin and User ship pre-defined, and the User Role starts as a full-visibility, read-only account on a fresh install.
Local accounts, or Active Directory and LDAP with SSL/TLS by default; a self-signed domain controller's CA certificate uploads to Network Analyzer for validation. An administrator can change a user's password, Role, or authentication method, and enable, disable, or delete accounts.
| Item | Details |
|---|---|
| Interfaces | Web interface plus a REST API for querying check results and building custom integrations. |
| Licensing | Each key covers three installs: production, test or lab, and a disaster recovery server held in non-operational mode. Keys are entered during license activation. |
Nagios Network Analyzer is a perpetual license: you buy it once, and it does not renew or price by seat.
Your purchase includes the first year of Maintenance & Support, covering product updates, technical support with one-business-day response, and a dedicated Customer Success Manager.
Renewing after year one keeps updates and support active.
Monitor and analyze the health of your network.
Yes. Flow collection, bandwidth charts, top talkers, queries, dashboards, alerting, and reports are all part of the base install and run without Wireshark, Suricata, or Nmap. A server that skips those three stays at the base requirement of one core and 2 GB RAM, and you can add any of them later from the interface.
Where the results go, mostly. A free collector can threshold and email, but the alert stays inside that tool. Network Analyzer delivers each result as a passive check into Nagios XI or Nagios Core over NRDP, so a traffic problem lands in the same queue as your Host and Service checks. SNMP traps, email, Slack, and custom commands are available too.
Breadth is the other half. One alerting config covers bandwidth and saved queries, Suricata Signature IDs, the open ports from a scheduled Nmap scan, and the collector's own CPU, memory, root drive usage, and job worker availability.
Queries themselves use nfdump syntax, so the filtering is comparable. The rest of the difference is the layer around it: retention you tier through Traffic Profiles, Role-based access with Active Directory and LDAP, scheduled PDF and JPG reports, and a documented upgrade path between releases.
Network devices can export a summary record for each conversation crossing an interface, covering the addresses and ports on both ends, the protocol, and the volume moved. A network analyzer collects those records, stores them, and turns them into bandwidth charts, top talker rankings, and queries you can filter. It reads what the network already reports rather than installing an agent on every Host.
Bandwidth monitoring measures how much of a link's capacity is being used, over time, so you can tell a saturated circuit from a healthy one. Interface-level bandwidth monitoring reads a counter on the device and gives you a single total per interface. Flow-level bandwidth monitoring reads the exported records and splits that total by address, port, and protocol, which is what tells you where the traffic came from. Network Analyzer does the second. Nagios XI covers the first through SNMP bandwidth monitoring on Host and Service checks.
Point an exporter at a Source, then open the Source Summary page. Top talkers ranks the addresses and ports moving the most data for the window you select, and selecting a value opens the Queries tab with that filter applied. WhoIs and reverse DNS resolve an unfamiliar address in place. Attribution is as granular as the records the exporter sends, so a device behind network address translation appears as the translated address.
NetFlow, sFlow, jFlow, and IPFIX. Most flow protocols are close enough to NetFlow to be treated the same way. sFlow is the exception, because it samples packets and derives the rest statistically, so set the flow type correctly when you create the Source.
A flow record summarizes a conversation: endpoints, ports, protocol, and volume. A packet capture keeps the packets themselves, including payload. Flow data is cheap enough to run continuously across every exporter and answers who and how much. Captures cost far more storage and are run against a specific interface for a set duration, and answer what was actually sent. Network Analyzer does both, so you can start from the flow record and capture only where you need the detail.
Network Analyzer runs as its own server with its own interface, users, dashboards, alerting, and reports. Running it alongside Nagios XI adds the Network Analyzer Wizard, the Network Traffic Analysis tab on Host and Service detail pages, and two Network Analyzer reports in the XI Reports menu. Nagios XI covers the availability and performance side with Host and Service checks, including network device monitoring for interface state and device health.
The onboarding, integration, and interfaces are built in. Each tool installs alongside Network Analyzer: open its section in the interface, run the install commands it supplies, then refresh the page to reach that tool's tabs. Size the server for what you install, since each integration raises the processor and memory minimum by one core and 2 GB RAM.
The Suricata integration matches traffic against signature rules from the rulesets you enable and records each match as an alert with a Signature ID, category, and severity. Nmap reports which ports and Hosts answered a scan, and an Ndiff shows what changed between two scans. These are rule matches and scan results your team acts on, and they reflect the rules and targets you configure.
It depends on your environment, and there is no single number that fits every install. Four things drive it: how many flow records per second your exporters send, the Raw Data Lifetime you set on each Source, how many Traffic Profiles you extend retention for, and whether Wireshark and Suricata are installed, since packet captures and Suricata alerts are stored separately from flow data.
The published guideline is 128 GB free as a minimum and 1 TB or more recommended. Granular flow files are removed once they pass a Source's data lifetime, which starts at 24 hours, while aggregated bandwidth history is kept separately, so long-term charts survive after the per-flow detail is gone. If you know roughly how many flows per second you expect, email [email protected] and we can size it with you.
Yes, and the migration guide covers it. The 2026 release moved the backend to Laravel, replaced RRDTool with InfluxDB for time series data, and rebuilt the interface, so read the migration steps first. Check the operating system as well, since support for RHEL 8, Oracle 8, Debian 11, and Ubuntu 20.04 LTS and 22.04 LTS ended with 2026R1. Once on 2026R1.2 or later, further updates apply from the Check for Updates page.
30 days with the full feature set. Every license key covers three installs: a production server, a test or lab server, and a backup server held in non-operational mode for disaster recovery. Email [email protected] for licensing detail.
30-day full access to all capabilities with guided demonstration of integrated network analysis features.


