


A failed uplink, a saturated interface, or a DNS server that stops answering will take applications down long before anyone files a ticket. Nagios XI polls your routers, switches, firewalls, and network services on a schedule you define, compares each result against thresholds you set, and sends notifications when a check returns a Warning or Critical state. Nagios Network Analyzer adds flow data collection so you can see which Hosts, applications, and protocols are consuming capacity.
What Is Network Monitoring?
Network monitoring is the continuous collection of availability and performance data from network devices, links, and services, measured against defined thresholds so that failures and degradation trigger an alert. A monitoring server polls each device on an interval, records the result as a state such as OK, Warning, or Critical, stores the numeric performance data for trending, and notifies the people responsible when a state changes.
Network monitoring answers whether a device is reachable, whether an interface is passing traffic, and whether a service is responding within an acceptable time.
Why Network Monitoring Matters
- Failures surface before users report them: Scheduled polling and inbound Simple Network Management Protocol (SNMP) traps register a Down interface or an unreachable device without waiting for a helpdesk call.
- Capacity decisions get evidence: Stored throughput data per port turns an argument about a link upgrade into a chart.
- Troubleshooting starts with a smaller haystack: Parent and child relationships between Hosts suppress alerts for devices sitting behind a failed upstream router, so the alert you receive names the actual fault.
- Remote sites stay visible: A central Nagios XI server checks WAN links and branch devices without a separate monitoring install at each location.
- Availability is documented: Reports covering uptime and state history give you the record an SLA review requires.
Network Monitoring Capabilities in Nagios XI
-
Router and Switch Monitoring
The Network Switch/Router Wizard scans a device over SNMP and returns its interface list, so you can select the ports to monitor and set per-port thresholds in the same pass.
- Interface selection: The wizard reports whether each port is administratively Up or Down and lets you enable throughput and port status checks per interface.
- Threshold defaults: Set a default unit and default Warning and Critical values in Step 1, then adjust individual ports in Step 2.
- Bulk configuration: Paste a CSV of devices with matching port speeds and thresholds instead of repeating the wizard for each one.
- Additive re-runs: Running the wizard again against the same Host Name rescans for new ports and edits existing thresholds rather than creating a duplicate Host.
- Bandwidth Usage Report: Daily, weekly, monthly, and annual graphs plus daily totals per port live under Reports > Bandwidth Usage Report.
The updated wizard in Nagios XI 2026R1.4 and later uses a C plugin, performs fewer SNMP walks per check, and creates throughput checks compatible with Nagios Mod-Gearman (NMG) workers. Checks created by the legacy wizard must run on the Nagios XI server itself, so NMG distribution settings need to keep them local.
Documentation: Monitoring Switches and Routers in Nagios XI 2026 and Monitoring Switches and Routers in Nagios XI 2024 and 2026 (Legacy Wizard). For Meraki hardware, see Monitoring Meraki Switches with Nagios XI 2026.
SNMP Network Monitoring
SNMP monitoring covers any device that exposes an Object Identifier (OID) you want to watch, including firewalls, load balancers, uninterruptible power supplies, and environmental sensors.
- Arbitrary OID polling: The SNMP Wizard takes an OID, a display name, a data label, Warning and Critical thresholds, and the Management Information Base (MIB) to use for each check.
- SNMP v1, v2c, and v3: Version selection changes the credential fields the wizard presents, so v3 authentication and privacy settings are entered directly.
- OID discovery: The SNMP Walk Wizard and Walk Jobs tool scan a device to reveal which objects are available before you commit to a check.
- Reusable MIBs: Upload vendor MIBs so trap and OID definitions resolve to readable names.
Documentation: Using the SNMP Wizard in Nagios XI and Using the SNMP Walk Wizard and Walk Jobs Tool.
SNMP Trap Management
A trap is an asynchronous message a device sends the moment an event occurs, which in Nagios XI arrives as a passive check result. Where an active check on a five minute interval might take five minutes to notice a UPS switching to battery, a trap arrives immediately.
- Trap processing: SNMP Trap Translator (SNMPTT) matches each inbound trap against your trap definitions, then logs the event, generates an alert, and runs notifications or event handlers.
- Unmatched traps: Traps with no matching definition go to the Unknown Trap Log, which you can review to build the definitions you are missing.
- Nagios XI Trap Interface (NXTI): Add, edit, copy, disable, and search trap definitions from Admin > Monitoring Config > SNMP Trap Interface, review received trap logs, monitor the
snmpttprocess, and send test traps. - Passive Service Setup: Attach a passive Service to a trap definition so a received trap changes a Service state and triggers notifications.
NXTI requires the Enterprise edition license. Without it, traps are configured from the command line through SNMPTT instead. The SNMP Trap Interface is restricted to Nagios admins.
Documentation: Using SNMP Traps with NXTI in Nagios XI and Integrating SNMP Traps with Nagios XI.
Network Device Discovery
Auto-Discovery finds devices on your network that Nagios XI is not yet monitoring.
- Scan jobs: Define a subnet in CIDR notation, exclude specific addresses, choose whether to resolve names through system DNS, and run the job once or on a schedule. The scan uses ping and Nmap.
- New device detection: Re-running a job reports how many devices are new since the last scan, so devices added to the network surface on their own.
- Auto-Discovery Wizard: Turn scan results into monitored Hosts and Services, selecting or deselecting individual devices and checks before applying.
- Agent deployment: Deploy agents to discovered Hosts from the job results view, and export results as CSV.
The Services the Auto-Discovery Wizard creates are basic port checks. Depth such as CPU load or disk space comes from running the wizard that covers it. Documentation: Using Auto-Discovery in Nagios XI.
Network Mapping and Topology Visualization
- Parent and child relationships: Assign parent Hosts in Core Config Manager under Configure > Core Config Manager > Monitoring > Hosts. Devices one network hop from the monitoring server take localhost as their parent.
- NagVis automaps: Generate a map from those parent and child relationships at Home > Maps > NagVis, or build a custom map by placing Host and Service icons over an uploaded floor plan, rack photo, or network diagram.
- NOC display: Add a NagVis map URL as a View so it joins the rotation on a wall monitor.
- Geographic view: The World Map plots Hosts with latitude and longitude coordinates, which suits multi-site networks.
Documentation: Using NagVis in Nagios XI and Using the Nagios XI World Map.
Network Protocol and Service Monitoring
Configuration Wizards cover the network services other systems depend on.
- DNS Query Wizard: Verify that a fully qualified domain name resolves, check the answer against the address you expect, target a specific DNS server, and require an authoritative response.
- DHCP Wizard: Confirm a DHCP server offers a lease. Optional fields set the expected offered address, a simulated client MAC address, the listening interface, and unicast mode for a specific server.
- TCP/UDP Port Wizard: Check any custom or well-known port for a listener and a response within your threshold.
- Generic Network Device Wizard: Configure an ICMP ping check for appliances, sensors, and other devices that answer ping and need nothing more.
Documentation: Monitoring DNS Queries, Monitoring DHCP Servers, Monitoring TCP and UDP Ports, and Monitoring a Generic Network Device.
Network Monitoring Thresholds and Alerts
Nagios XI evaluates each check result against the Warning and Critical values you supply. Nothing is inferred: a port is Critical because its throughput crossed the number you entered, and the notification tells you which number and which port.
- Per-object thresholds: Set values at the wizard level for a whole device, then override individual ports or Services in Core Config Manager.
- Notification routing: Contacts and contact groups determine who is notified for which Hosts and Services, on which states, during which time periods.
- Escalations: Route repeat notifications to a wider group after a defined number of unresolved alerts.
- Message content: Customize the variables included in email and SMS notifications so an alert carries the device, Service, state, and output your team acts on.
- Event handlers: Run a script on a state change, for example to restart a Service before the notification escalates.
Network Monitoring Dashboards and Reports
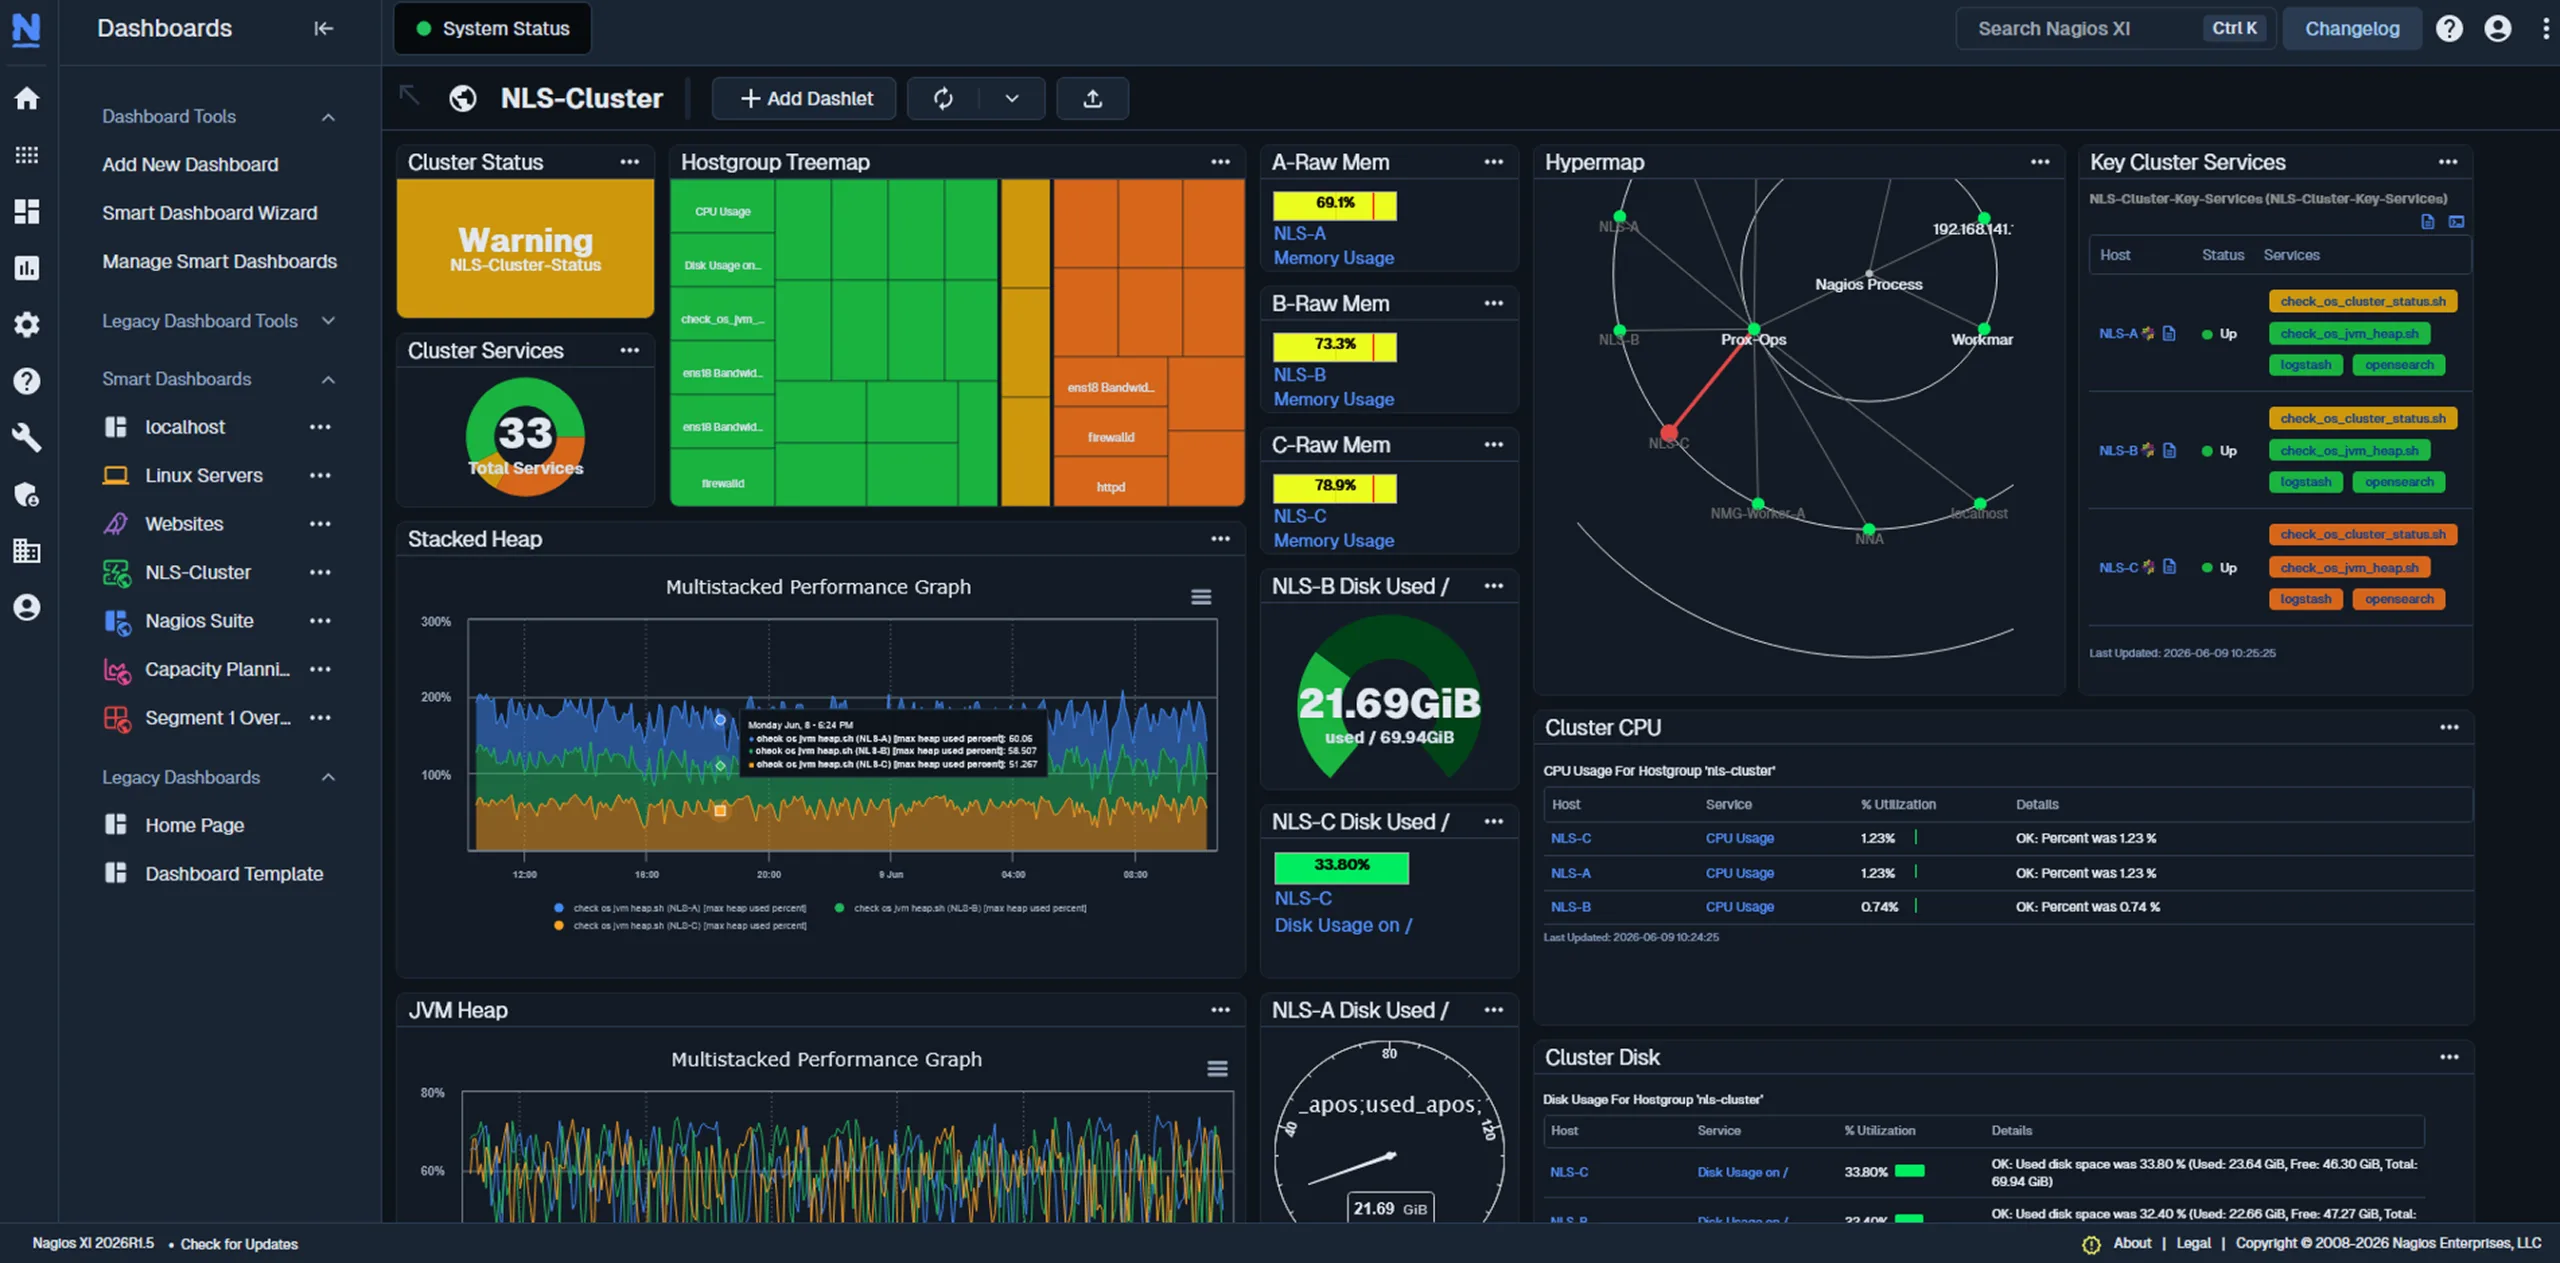
- Per-user dashboards: Each user builds their own dashboards from dashlets, so a network team and an application team see different views of the same data.
- Views: Rotate Nagios XI pages and external URLs on NOC displays.
- Availability and state history: Report on uptime and state transitions per Host, Host group, or Service group.
- SLA reporting: Set a target percentage and report attainment against it.
- Scheduled delivery: Email reports and pages on a schedule.
Documentation: Understanding and Using Dashboards in Nagios XI 2026 and Generating Reports with Nagios XI.
Network Monitoring Access Control
- Authorization levels: The default level for a new user is User, the most restrictive setting in Nagios XI. With no additional options selected, that user sees only the Hosts and Services on which they are named as a contact.
- Monitoring contacts: Enable Create as Monitoring Contact when adding a user so a matching contact object exists in the monitoring configuration, since most access is validated against the contact.
- Credential handling: Store SNMP community strings, agent tokens, and device passwords as User Macros and enable value redaction so they are not displayed in Core Config Manager or Configuration Wizards.
- Trap interface restriction: Only Nagios admins can reach the SNMP Trap Interface.
- SNMP credentials: Use a read-only community string or an SNMP v3 account scoped to the objects you poll. Do not reuse a device administrator credential for monitoring.
Documentation: Understanding User Rights in Nagios XI.
Network Traffic Monitoring with Nagios Network Analyzer
SNMP tells you how much traffic crossed an interface. Flow data tells you what that traffic was. Nagios Network Analyzer is a separately licensed solution that collects and analyzes flow records exported by your switches, routers, and servers.
- Flow protocols: Collects NetFlow, sFlow, jFlow, and IPFIX. Each Flow Source binds to its own listening port above 1024, and you select the incoming flow type when you create the Source.
- Traffic attribution: Reports and queries break traffic down by source and destination address, port, and protocol, so a saturated link resolves to the conversations filling it.
- Source Groups: Group Sources to view trends across several collection points without consuming additional disk space.
- Data lifetime: Set a Raw Data Lifetime per Source to bound how long granular flow data is retained, since flow files grow quickly.
- Alerting: Create checks on Flow Sources, Source Groups, and Traffic Profiles, and send results to Nagios XI or Nagios Core over Nagios Remote Data Processor (NRDP), to other applications as SNMP traps, or to a custom command.
- Nagios XI integration: Add flow data to Nagios XI reports, dashboards, and the Host and Service status detail tabs using a Nagios Network Analyzer API key.
Nagios Network Analyzer 2026 adds onboarding and interfaces for three open source tools that run alongside flow collection on the Network Analyzer server: Nmap for network scanning and scan comparison, Wireshark for packet capture and pcap analysis, and Suricata for intrusion detection with managed rulesets. Each integration adds to the server’s processing and storage requirements.
Documentation: Nagios Network Analyzer Administrator Guide, Understanding Network Flows, and How Alerting Works in Nagios Network Analyzer 2026.
Benefits of Nagios Network Monitoring
Faster fault isolation. Parent and child relationships mean a failed core switch produces one Critical alert for the switch rather than fifty for everything behind it. The alert names the device to fix.
Capacity planning backed by history. Per-port throughput is stored and graphed from the moment a device is added, so the case for an upgrade rests on twelve months of data rather than the week someone happened to notice congestion.
One console for the network and the systems on it. The same Nagios XI server that polls a switch also checks the database, web server, and virtual machines that depend on it, which removes the step of correlating across separate tools during an incident.
Predictable onboarding for new devices. Auto-Discovery finds what arrived on the network and the Configuration Wizards turn it into monitored Hosts and Services, so coverage keeps pace with change instead of drifting behind it.
Central visibility for distributed networks. Branch sites, WAN links, and cloud instances report to one Nagios XI server, and organizations running several monitoring servers can view them together in Nagios Fusion.
Network Monitoring Prerequisites
Confirm the following before running your first wizard.
- SNMP enabled on the device: An agent responding on UDP port 161, with a read-only community string for v1 or v2c, or authentication and privacy credentials for v3.
- Outbound polling path: Firewalls between the Nagios XI server and each device must allow UDP 161 from Nagios XI to the device.
- Inbound trap path: Traps arrive on UDP port 162 inbound to Nagios XI, which reverses the usual direction. Nagios XI ships with a firewall rule allowing UDP 162 inbound, so the work is on intermediary firewalls between the device and the monitoring server.
- ICMP permitted: Host reachability checks and Auto-Discovery scans depend on ping reaching the target.
- Agent ports where agents are used: Nagios Cross-Platform Agent (NCPA) listens on TCP 5693, Nagios Remote Plugin Executor (NRPE) on TCP 5666, and Nagios Service Check Adapter (NSCA) on TCP 5667. NRDP uses TCP 80 or 443.
- Flow export configured: For Nagios Network Analyzer, each exporting device must be pointed at the address of the Network Analyzer server and the unique listening port defined on the matching Flow Source.
- Disk headroom for flow data: Raw flow files grow with traffic volume and retention. Set Raw Data Lifetime deliberately.
Documentation: Nagios XI Ports and Protocols.
How To Monitor Your Network with Nagios XI
- Enable SNMP on the target routers and switches with a read-only community string or an SNMP v3 account, and confirm UDP 161 is reachable from the Nagios XI server.
- Navigate to Configure > Configuration Tools > Auto-Discovery and run a scan job against your subnet to inventory what is on the network.
- Navigate to Configure > Configuration Wizards, open the Network Switch/Router Wizard, and enter the device address, Host Name, and SNMP connection settings. Set default throughput thresholds in Step 1.
- In Step 2, select the interfaces to monitor, choose throughput and port status per interface, and adjust individual thresholds. Complete Steps 3 through 5 to set check intervals, notification contacts, and group membership, then click Finish.
- Add the network services those devices carry using the DNS Query, DHCP, and TCP/UDP Port wizards, then build a dashboard or NagVis map so the whole path is visible in one place.
Full walkthroughs: Monitoring Switches and Routers in Nagios XI 2026, Using Auto-Discovery in Nagios XI, and Understanding and Using Configuration Wizards in Nagios XI.
Where Nagios Fits in Network Monitoring
Nagios XI is the monitoring engine for device and Service state: reachability, interface status and throughput, protocol availability, response time, and the health of the servers and applications riding on the network. It evaluates results against thresholds you define and acts on the outcome. Nagios Network Analyzer covers what SNMP counters cannot describe, namely which conversations make up the traffic on a link, and in the 2026 release extends into packet capture, network scanning, and intrusion detection through its Nmap, Wireshark, and Suricata integrations.
Centralizing syslog and application logs for search and retention is the job of Nagios Log Server, which is licensed separately from Nagios XI. Viewing several Nagios XI, Nagios Core, Nagios Network Analyzer, and Nagios Log Server instances through a single high-level dashboard is the job of Nagios Fusion. Distributing check execution across workers within a single Nagios XI deployment is handled by Nagios Mod-Gearman, and accepting passive results from remote collectors is handled by NRDP and NSCA. Configuration management, automated remediation beyond event handler scripts, and statement-level application profiling fall outside all of these.
Frequently Asked Questions
Does Nagios network monitoring require an agent on every device?
No. Routers, switches, firewalls, and most network appliances are monitored agentlessly over SNMP and ICMP, which is why the Network Switch/Router Wizard and SNMP Wizard need only an address and credentials. Agents such as NCPA are used on servers and workstations where you want operating system detail like CPU, memory, disk, and process state that SNMP does not expose as usefully.
Is Nagios network monitoring open source or free?
Nagios Core is the open source monitoring engine and is free to use, with configuration maintained in text files. Nagios XI is the commercial solution built on that engine, adding Configuration Wizards, dashboards, reporting, Auto-Discovery, and the web-based Core Config Manager, and is licensed by monitored Nodes (Hosts). A free trial of Nagios XI is available.
Do I need Nagios Network Analyzer if I already run Nagios XI?
Only if you need to know the composition of your traffic. Nagios XI already reports how much data crossed each interface through SNMP polling and the Bandwidth Usage Report. Nagios Network Analyzer answers the next question, which is which addresses, ports, and protocols that data belonged to. The two are licensed separately and integrate through an API key and NRDP.
Does Nagios XI need the Enterprise edition for SNMP traps?
The Nagios XI Trap Interface (NXTI), which manages trap definitions and received trap logs from the web interface, requires the Enterprise edition license. Nagios XI can receive and process traps without it by configuring SNMPTT from the command line.
Can Nagios perform packet capture or intrusion detection?
Those capabilities belong to Nagios Network Analyzer 2026, which provides integrated interfaces for Wireshark packet capture with pcap import and export, Suricata intrusion detection with managed rulesets and alert thresholds, and Nmap scanning with scheduled scans and Ndiff comparison. Each integration is installed on the Network Analyzer server and adds roughly one processor core and 2 GB of RAM to its requirements. Nagios XI itself does not capture packets.
Can I upgrade Nagios Network Analyzer 2024 directly to 2026?
No. A direct in-place upgrade from Network Analyzer 2024 to 2026 is not supported. Use the documented migration path, which includes a tool for moving historical flow data held in custom data directories. Plan this as a migration with a maintenance window rather than a routine upgrade.
How does Nagios monitor WAN links and remote offices?
A single Nagios XI server can poll devices at remote sites directly, provided the required ports are reachable across the WAN. Where a site should not be polled across the link, run checks locally and return results as passive checks over NRDP or NSCA. Where you already operate a monitoring server per region, Nagios Fusion presents them together.
How many devices can one Nagios XI server monitor?
The practical ceiling depends on check volume, check interval, and the resources on the monitoring server rather than a fixed device count. Where check execution outpaces a single server, Nagios Mod-Gearman distributes checks across worker nodes. Note that checks created by the legacy Network Switch/Router Wizard must run on the Nagios XI server itself; the updated wizard in Nagios XI 2026R1.4 and later creates throughput checks that Mod-Gearman workers can run.
Does Nagios detect unusual or malicious network activity?
Nagios XI compares each check result against the Warning and Critical values you configured and changes state when a threshold is crossed. A spike in interface throughput at 3 a.m. registers as Critical because it exceeded your number, not because Nagios XI judged it suspicious. Signature-based detection of malicious traffic comes from the Suricata integration in Nagios Network Analyzer 2026, which matches packets against rulesets you enable and maintain.
Related Solutions
Network Devices
- Router Monitoring for interface status, throughput, and reachability on routing hardware.
- Switch Monitoring for per-port status and throughput across access and distribution switches.
- Ping Monitoring for ICMP reachability, packet loss, and round-trip time.
Traffic and Bandwidth
- Bandwidth Monitoring for interface utilization and the flow data behind it.
- LAN and WAN Monitoring for link health across sites.
Protocols and Services
- SNMP Monitoring for OID polling on any SNMP-enabled device.
- SNMP Trap Management for trap definitions, processing, and passive alerting.
- DNS Monitoring for resolution checks and expected-address verification.
Nagios Solutions
- Nagios XI for Host, Service, network device, and application monitoring.
- Nagios Network Analyzer for flow data collection, traffic analysis, packet capture, and intrusion detection.
- Nagios Log Server for centralized log collection, search, and retention.
- Nagios Fusion for a single view across multiple Nagios instances.
- Nagios Core for the open source monitoring engine.
Start Monitoring Your Network
Point the Network Switch/Router Wizard at one core switch and you will have port status, throughput thresholds, and bandwidth graphs within an afternoon. Add the rest of the network from there.
Download a free 30-day trial of Nagios XI or schedule a guided demo with the Nagios team.