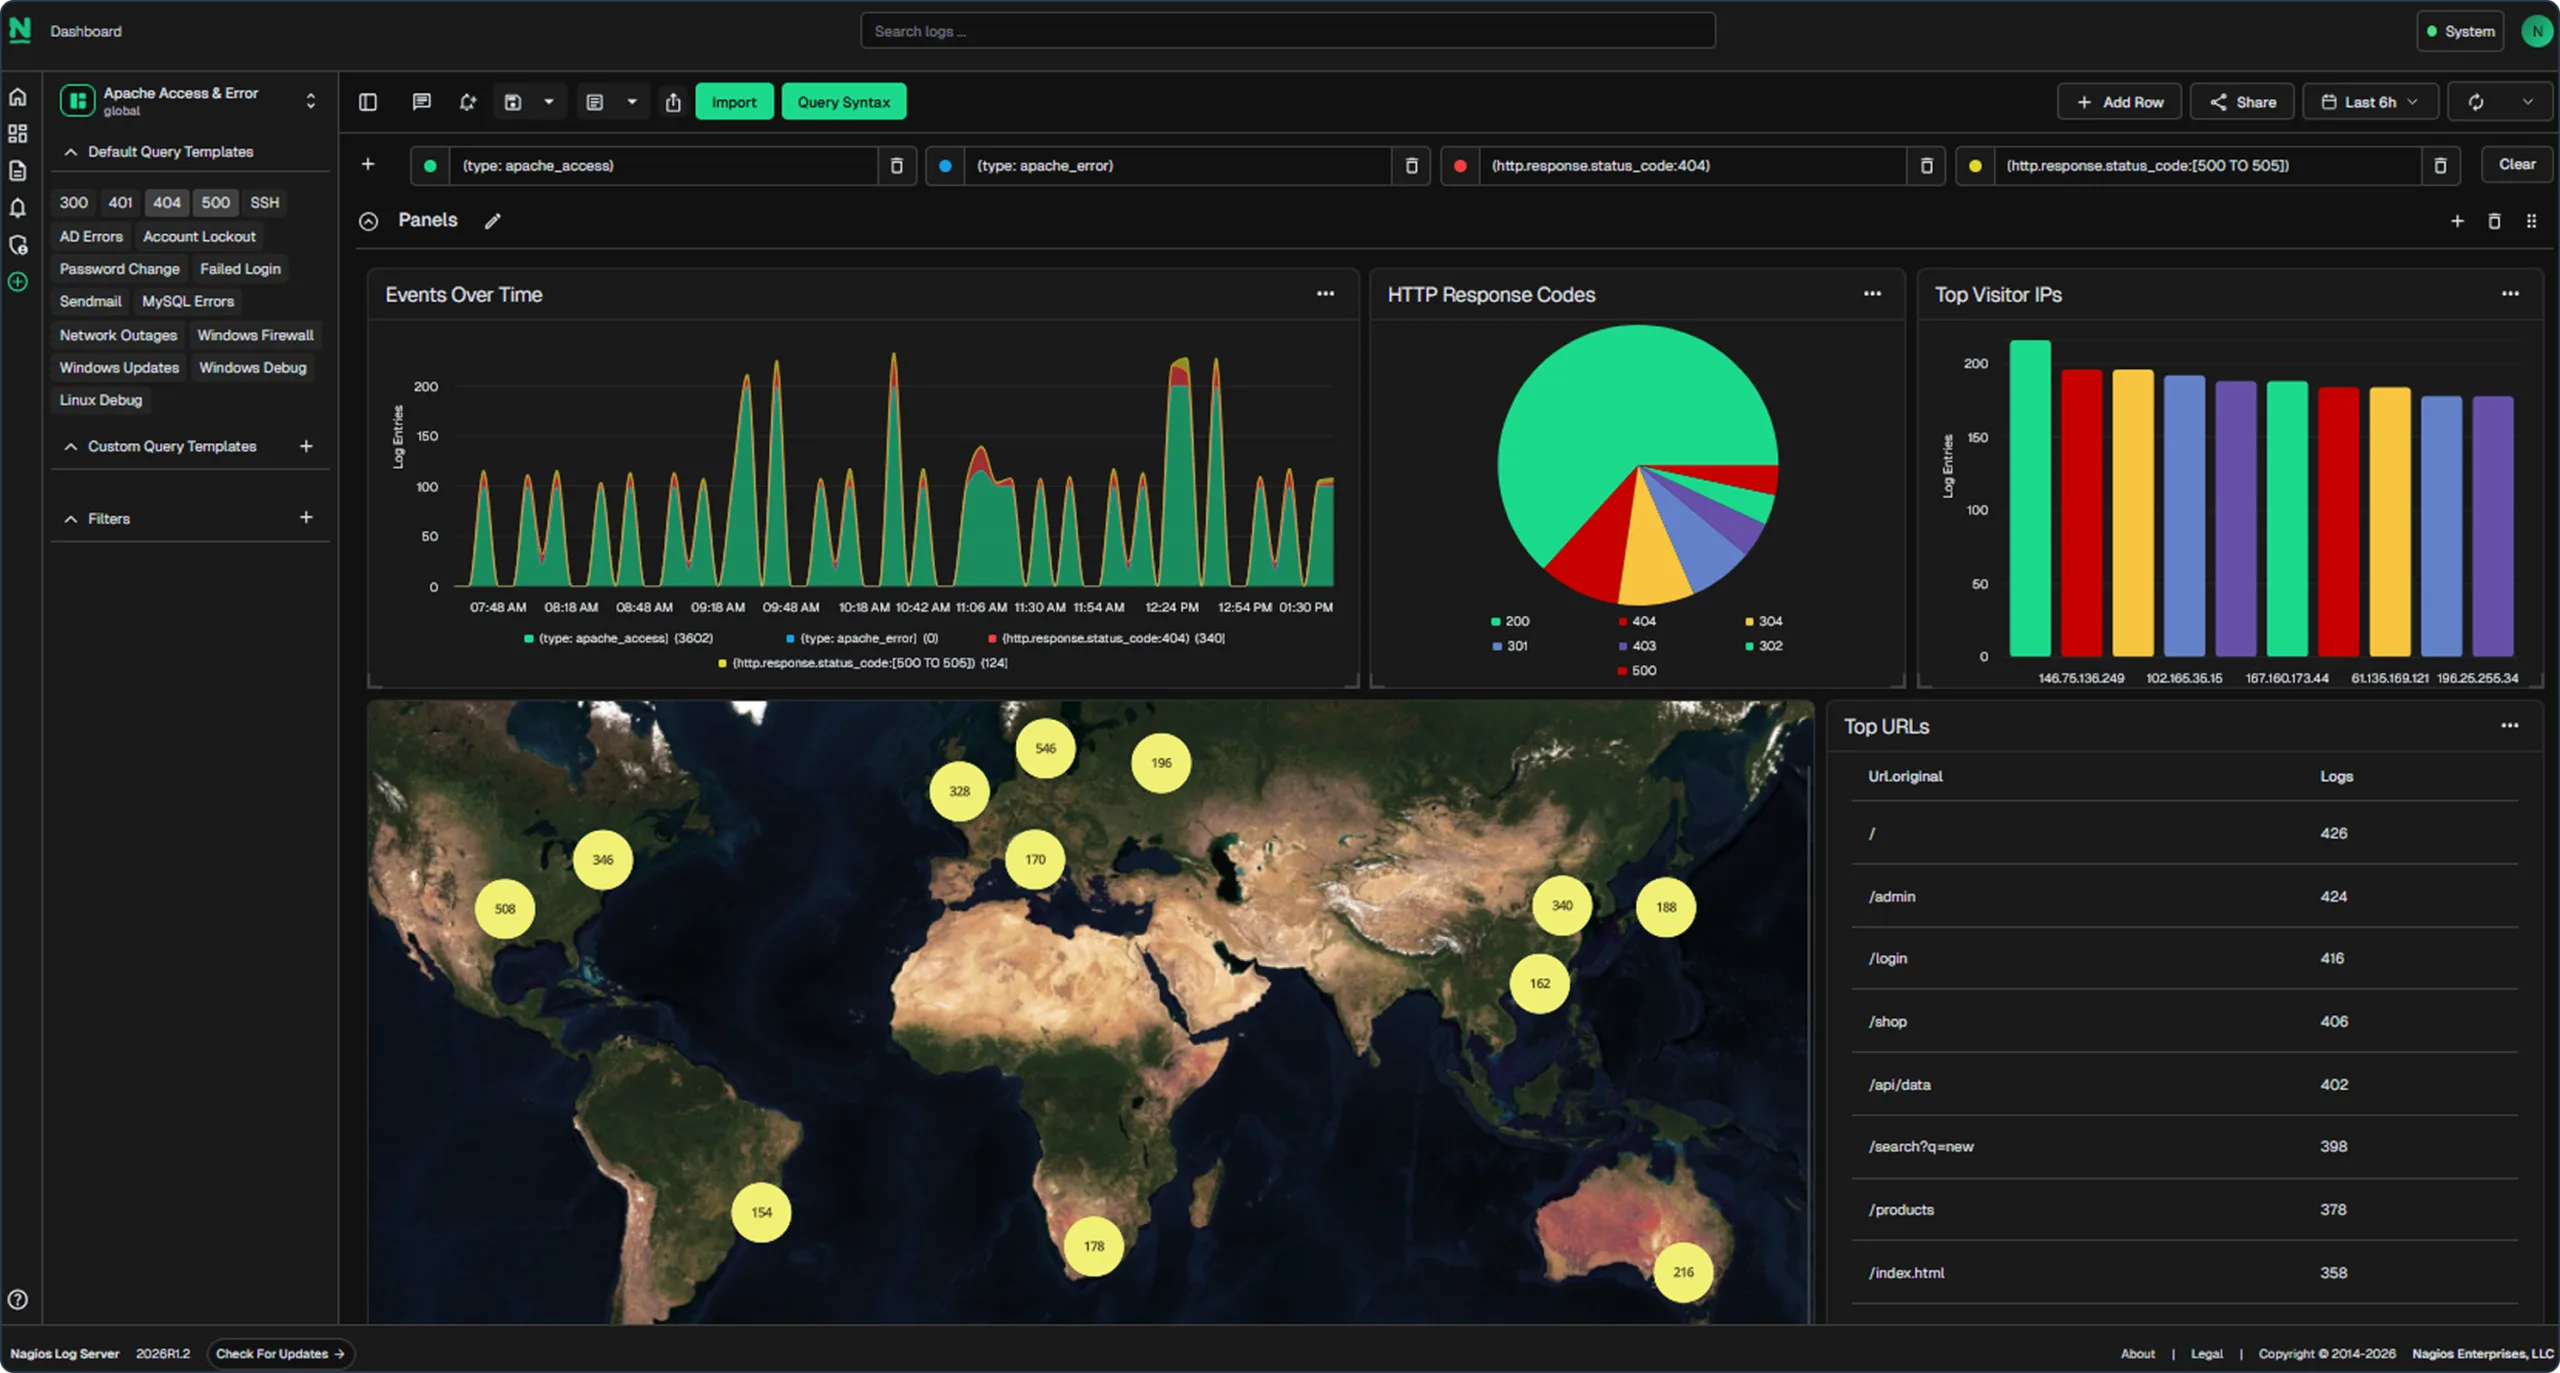
Nagios Log Server collects syslog, Windows Event Logs, and application logs from every host into one searchable cluster on your own hardware. Query them, alert on them, and keep them as long as you need, with no per-gigabyte bill.
Free 30-day trial with the full feature set. Installs on your own server, on premises.
Trusted by 10K+ Teams Worldwide


A syslog server tells you the logs arrived. Nagios Log Server tells you which host wrote them, what happened around them, and when the pattern you care about shows up next.

Search the whole environment at once instead of opening a terminal on each machine in turn. Investigations that used to run an hour finish before the bridge call fills up.

Logs stay until you decide otherwise, not until the sending host recycles its own file. Post-incident reviews and audits reach as far back as your disk does.

Alerts fire on the patterns you define, so the error nobody was watching for reaches someone before a customer does.
Each source ships with what it already has: the syslog daemon on Linux and UNIX, the built-in export on switches, firewalls, and ESXi, and NXLog on Windows. The setup script writes that config for you, and entries are searchable about five seconds after they land.
Linux, UNIX, macOS, and most network gear send to one input on TCP and UDP port 5544, and the setup script configures the sending host for you. SNMP traps and JSON each have an input of their own.
Windows is the one place something gets installed, and it is NXLog Community Edition, free and lightweight. The setup page prefills your server address and port, so the rest is a paste into nxlog.conf and a service restart.
Point an input at a path to pick up Apache, MySQL, and application logs, including multi-line entries such as Java stack traces. Default dashboards and reports ship for Apache, MySQL, and Sendmail.
Extract fields from unstructured text, resolve addresses to DNS names, attach geographic location, and drop what you do not want to store. Field extraction is what makes a log line rankable and chartable rather than only searchable.

Type what you are looking for and read the matching events, reach for Lucene when you need field matches, wildcards, and boolean operators, and save any search you run twice for a dashboard or an alert. Integrate AI for fast, intuitive log analysis with natural language queries.
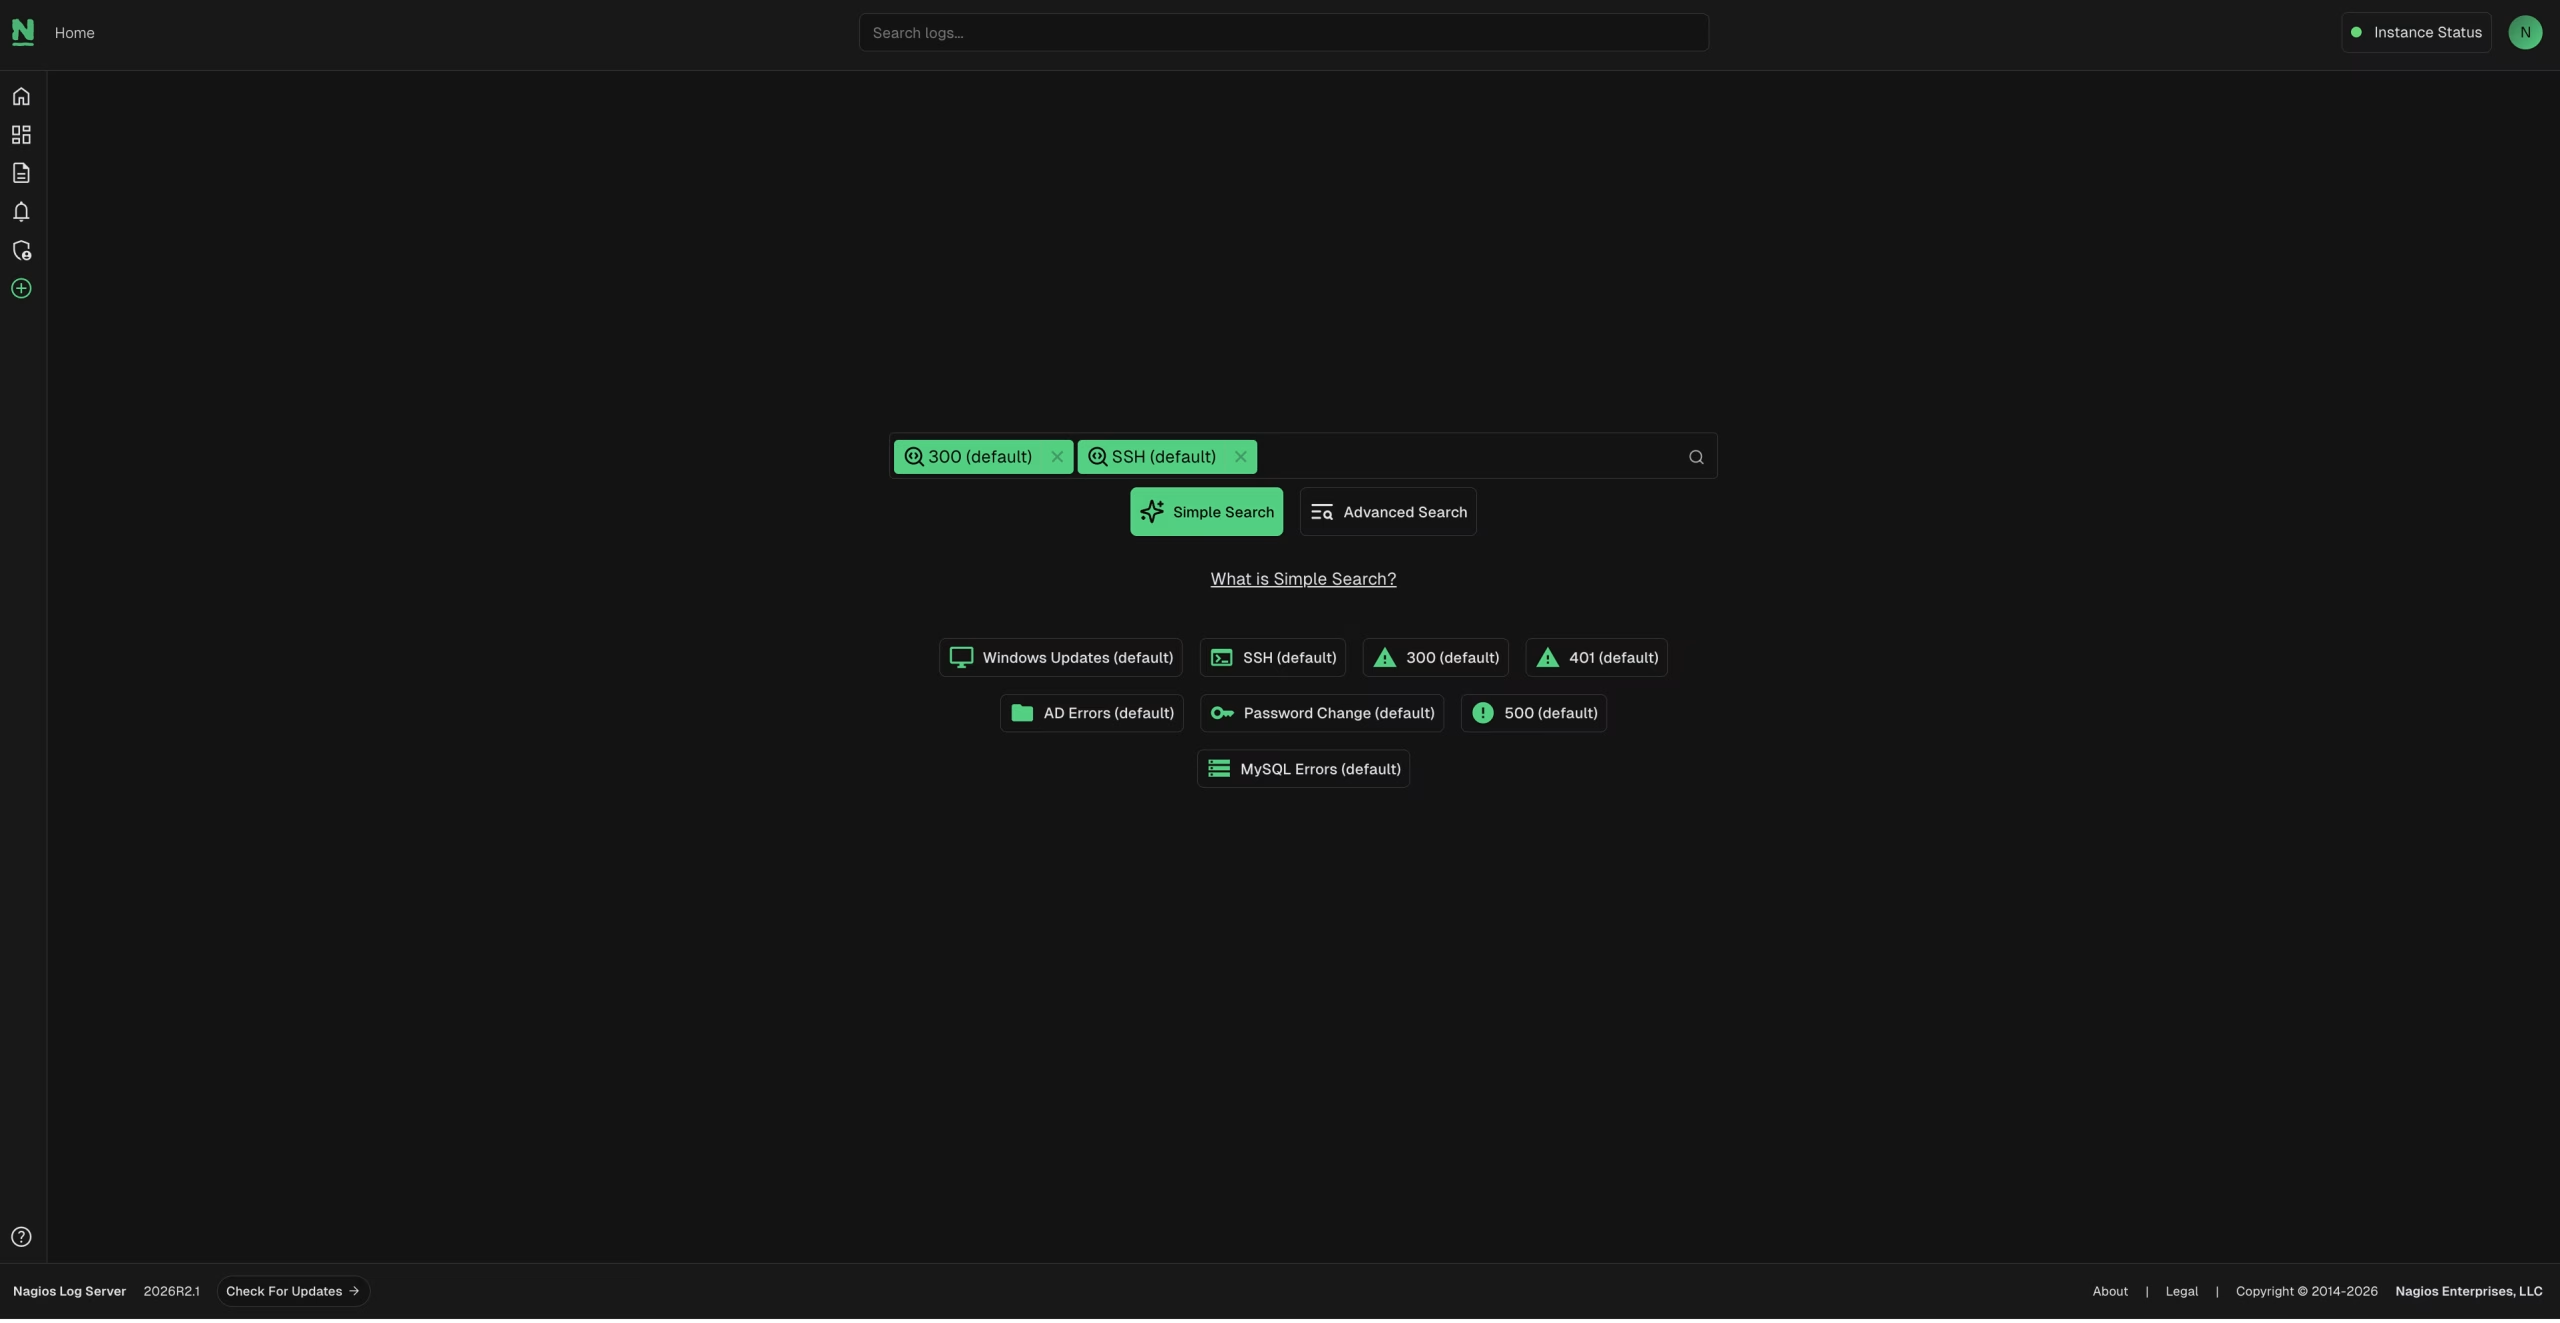
Type, pick a range, read the results. Query templates appear as you type, and the Simple and Advanced toggle switches views per user.

Field matches, wildcards, boolean operators, and ranges, with inline query help and a colour assigned to each query on a dashboard.

Keep the searches you run repeatedly and reuse the same query in dashboards and in alerts.

Expand and compare multiple entries inline from the log table, with timestamps converted to your locale.
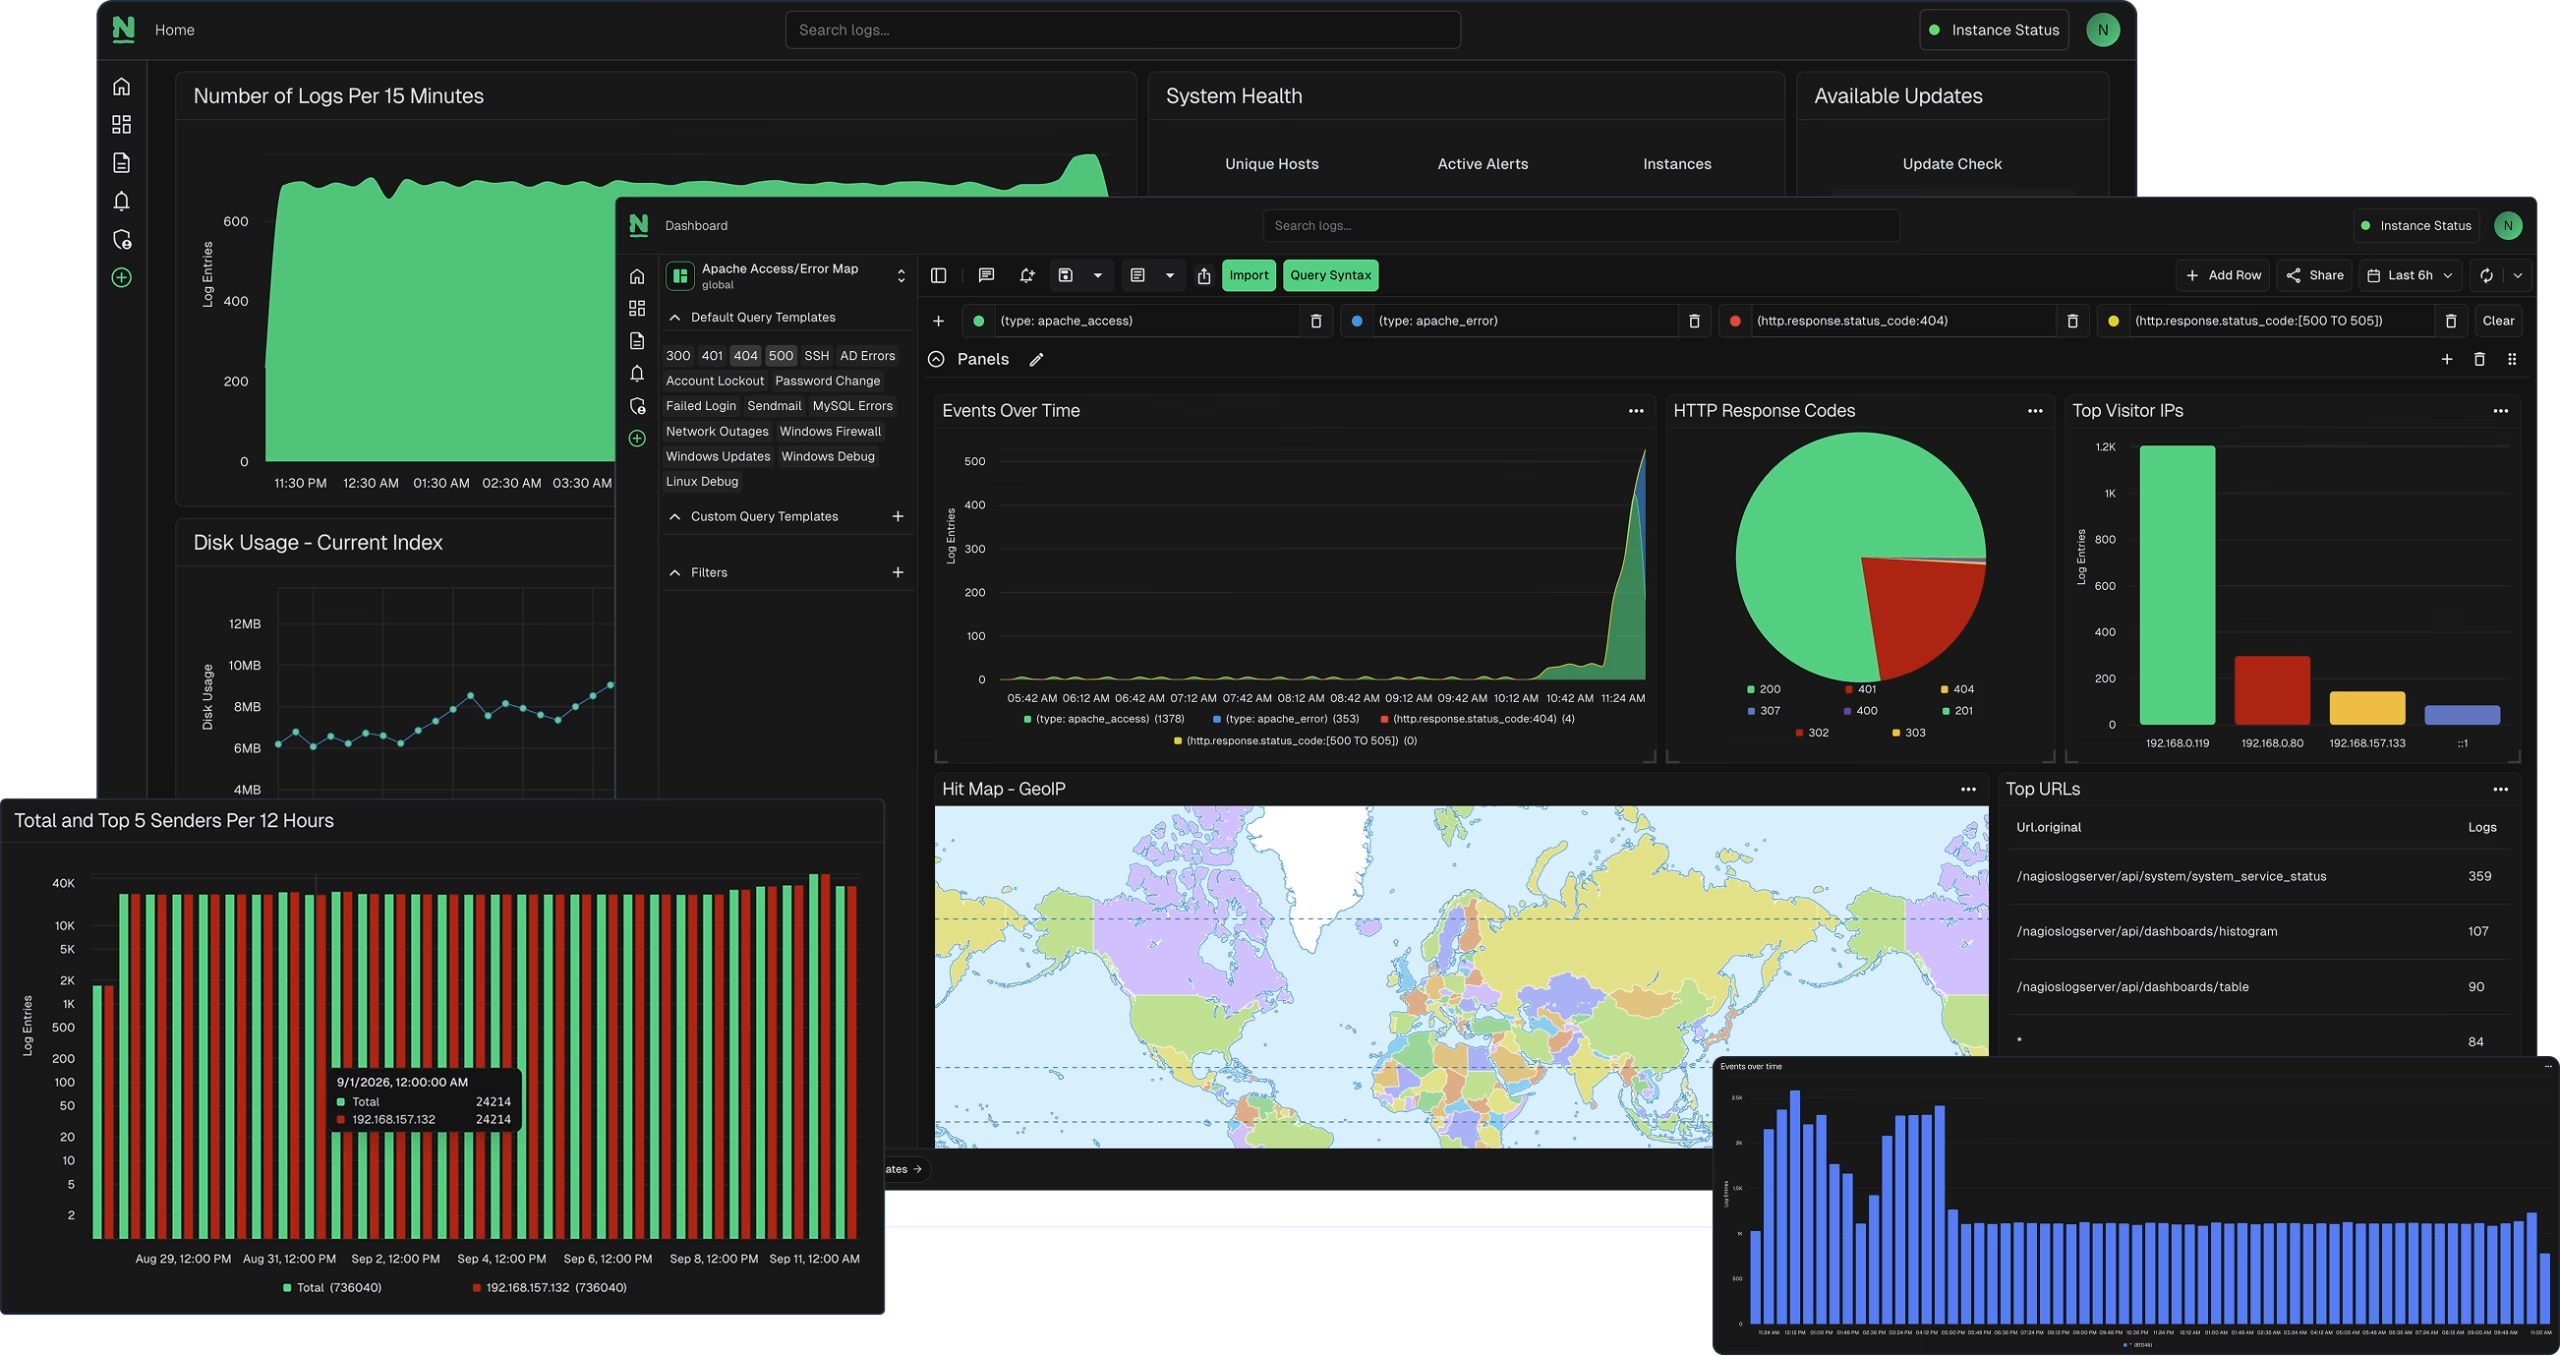
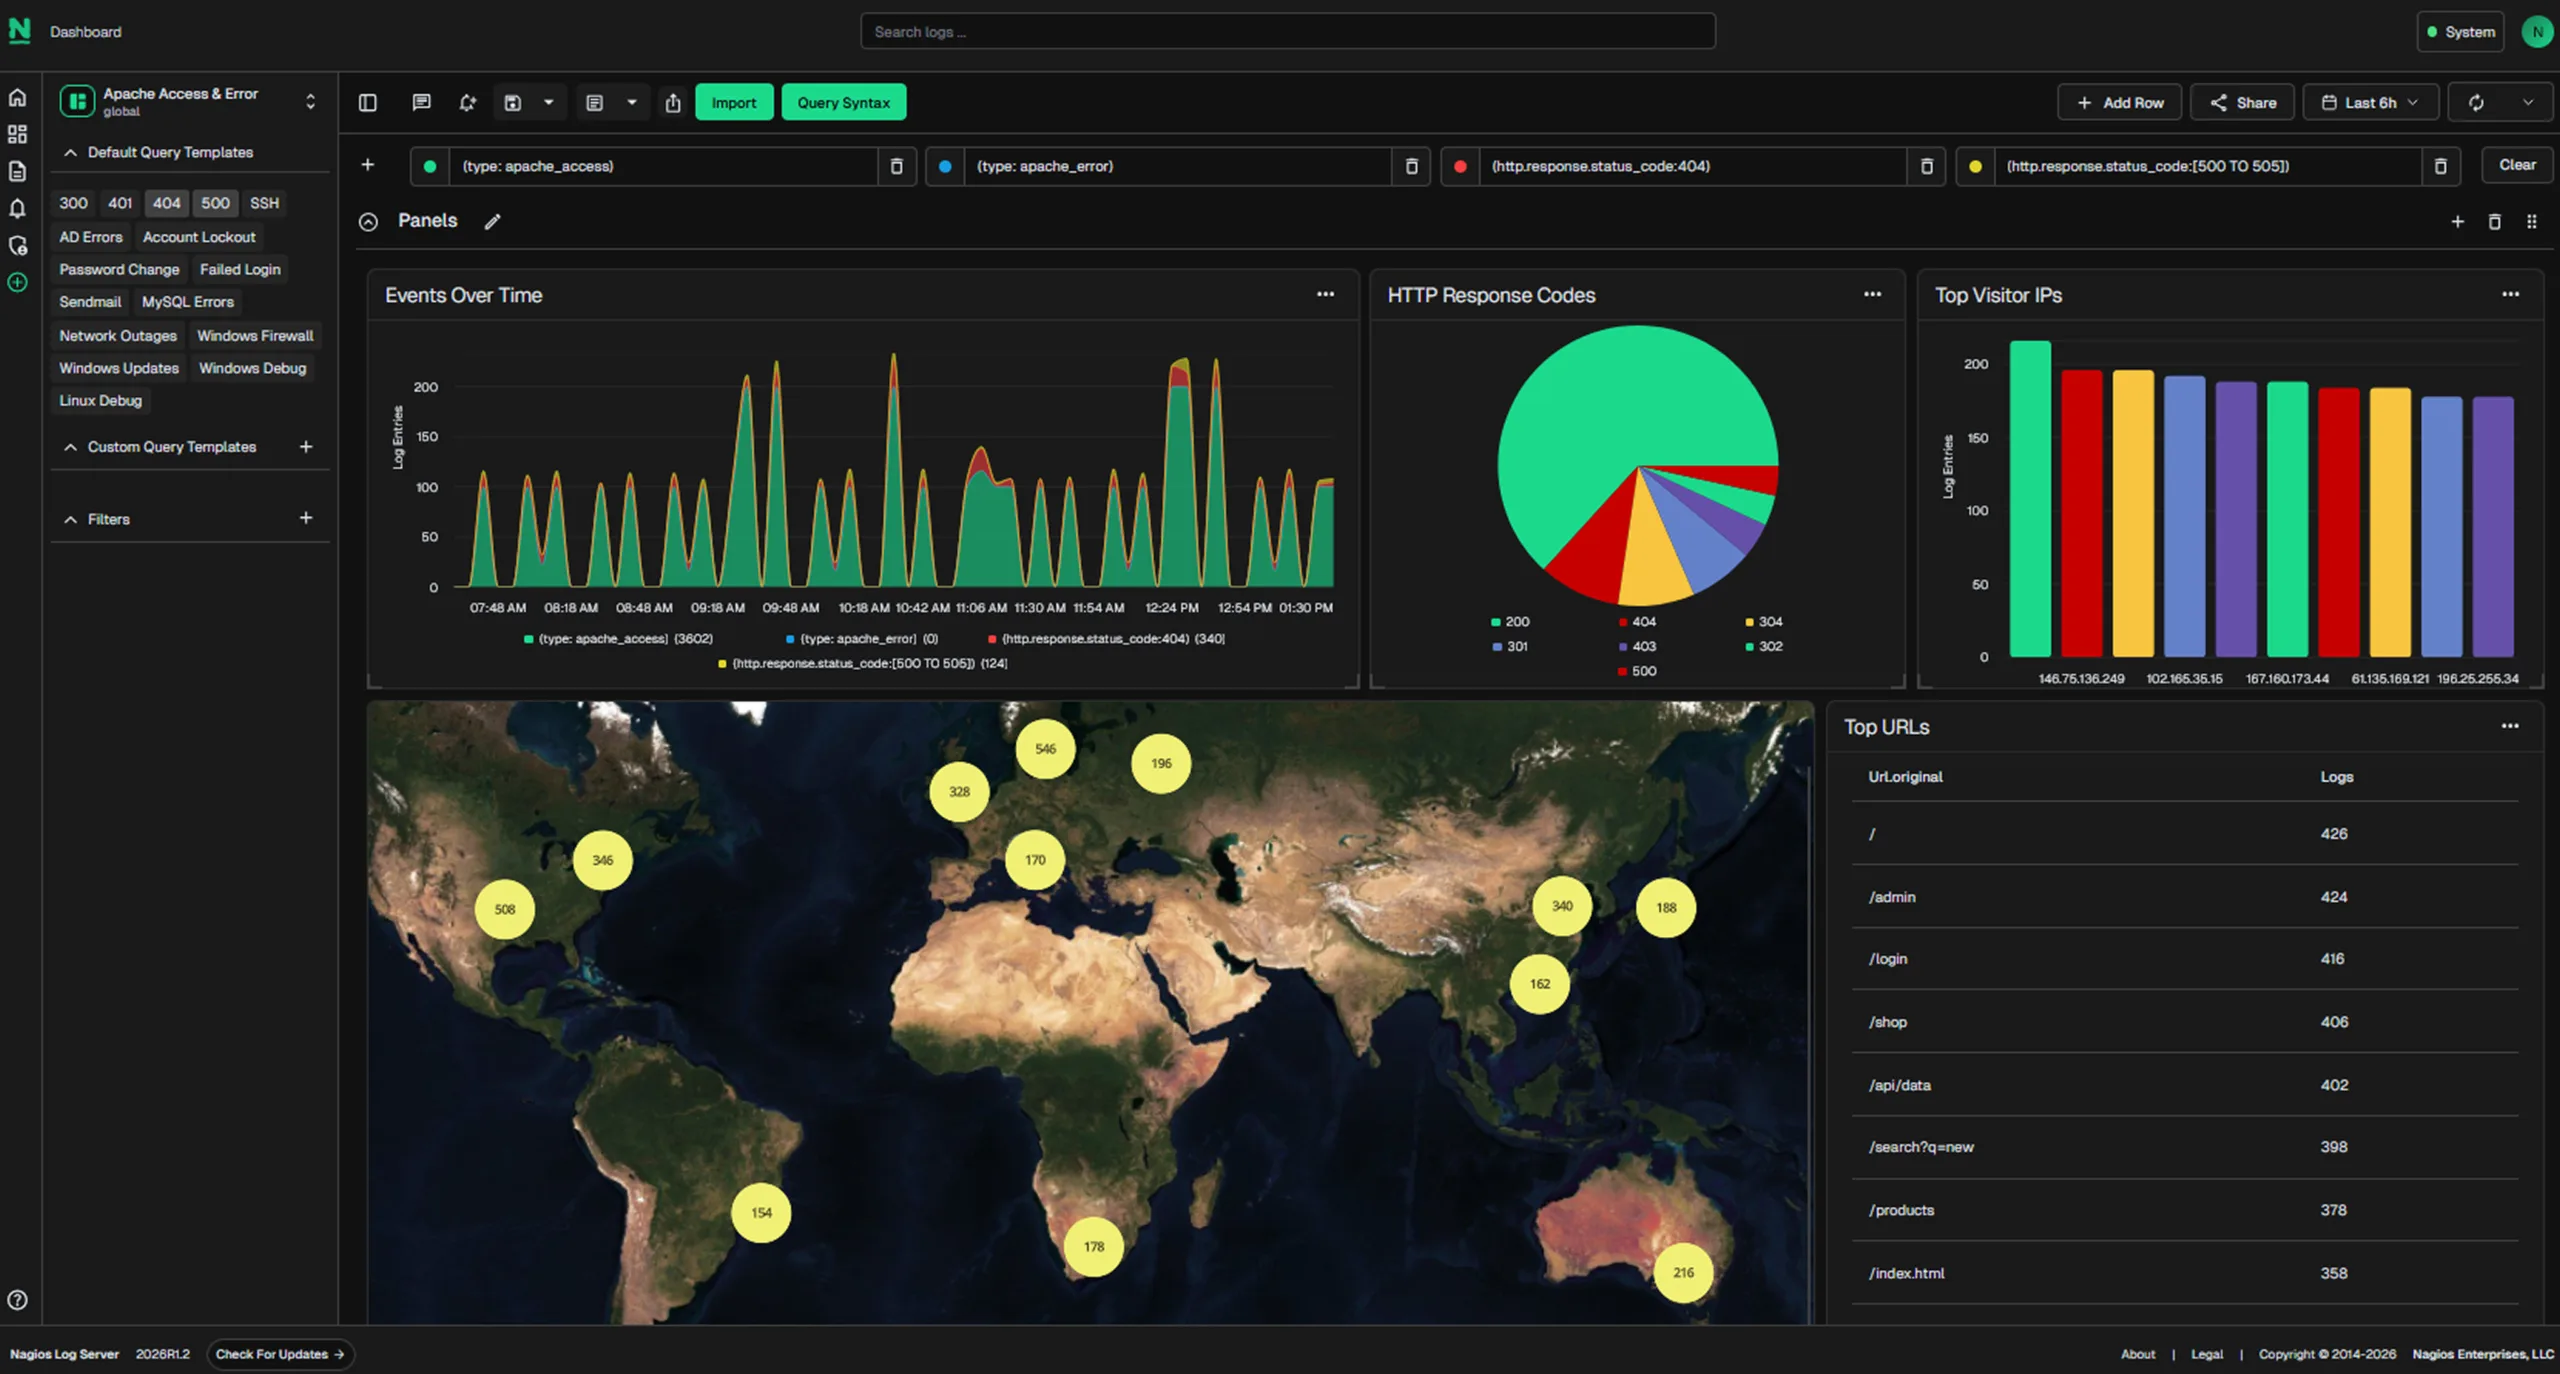
Every panel is driven by a saved query, so the searches you already run become the dashboard without rebuilding them. One option turns that dashboard into a report, scheduled and delivered as a PDF to people who will never log in.
Histograms with stepwise zoom and logarithmic scaling, a log table with column reordering and search term highlighting, a terms panel as bar, donut, or tilt, a map panel plotting source addresses, and cluster panels for OpenSearch disk usage and index counts.
A dashboard is saved to your own account, or published so everyone sees it. Export and import moves one between deployments. Light and dark modes plus a compact mode that reduces padding when you are fitting a lot on one screen.
Default Reports for Apache, MySQL, and Sendmail ship with the solution and run as soon as those sources are sending, so something useful exists before anyone has built a dashboard.
Any dashboard becomes a Saved Report with Save as Report, then runs on a recurring schedule and arrives by email as a PDF or JPG attachment. Scheduled Reports are edited, hidden, or deleted from Report Management, and deleting a report takes its schedules with it.
Any query you can save, you can alert on.
Set the interval, set Warning and Critical thresholds against the number of results, and the pattern you went looking for once gets watched from then on. Three kinds of alert cover three different timing problems.


A saved query runs on the interval you set, and the number of results is checked against your Warning and Critical thresholds.

These live in the Logstash configuration and evaluate each event as it is ingested, which removes the wait for the next interval.

Fire when a host stops sending logs, which is the failure a query alert cannot catch because the matching events never arrive.
In regard to log based alerts, using NLS provides great advantages generally for our users, especially using the several different type of options for alert thresholds. The default query for failed user logins enables us to detect network intrusions, which is extremely useful.
Henrik Normann-Hansen, Sys Admin
Each day gets its own index, and what happens to it is your call. Nothing ages out on a schedule you did not choose, and nothing meters what you keep.
Leave an index open and searchable, close it to free the memory and query load it was using, or delete it. A closed index still occupies disk, it just stops costing you performance, and reopening it brings the data straight back.
Point-in-time index backups, written to an NFS or CIFS share every instance can reach, because each instance writes the shards it holds. Run them on the maintenance schedule or on demand.
Restore a snapshot and the archived period queries exactly the way current data does.

Long retention and reproducible search are what an audit or an incident review asks for, and Log Server gives you both on storage you own. Interpreting a specific framework’s requirements, and deciding what satisfies them, stays with you.
A deployment is a cluster. Every instance shares in indexing, searching, and storage, and each index is split into shards with copies on other instances, so losing a disk does not lose a day.
Each index is split into shards, and each shard has a copy on another instance. Lose a server and the cluster keeps serving queries from the replicas while you replace it. Nagios recommends a minimum of three instances, because a replica needs a second instance to live on.
Assign the jobs each instance performs, so a larger cluster can separate indexing work from search work instead of every instance doing everything. Refined in 2026R1.
Upgrade one instance at a time until every member is on the same version, with shard allocation disabled during the work so the cluster does not start relocating data mid-upgrade.
Distribute inbound collection across instances instead of pointing every source at one address, so ingest is not bottlenecked on a single node. The interface can sit behind a load balancer too, because a login session is independent of the instance that served it, so a user is not signed out when the balancer moves them.

Log Server installs on a Linux server you own. Restrict what each team sees with host lists, authenticate against Active Directory or LDAP, and size the cluster for your daily volume.
| Requirement | Specification |
|---|---|
| Operating systems | RHEL, CentOS Stream, and Oracle Linux 8 and 9, and 10 from 2026R1.3. Debian 12, and Debian 13 from 2026R1.4. Ubuntu 22.04 LTS and 24.04 LTS. Exact supported releases across every product are listed in the OS compatibility matrix. |
| Processor and memory | 8 cores and 8 GB RAM per instance as a minimum. Both track daily log volume and query concurrency. |
| Storage | 1 TB per instance as a minimum. Actual use tracks daily log volume and how long you keep indices, so size this generously. The performance and storage walkthrough works through it. |
| Cluster size | Three instances recommended. Single-instance licensing is available and forgoes redundancy and failover. |
| Snapshot repository | An NFS or CIFS share reachable by every instance in the cluster. |
| Log sources | Any host or device sending syslog over TCP or UDP, Windows hosts running NXLog, files the server can read, and SNMP trap senders. |
| Backend | OpenSearch 3.1.0 and Logstash 9.1.1 since 2026R1. |
| Virtual machine images | Microsoft Hyper-V, VMware Workstation Player, VMware vSphere, and VirtualBox. |
On RHEL and Oracle Linux, enable the Optional software channel and CodeReady Builder before installing. Full documentation in the Nagios Log Server Administrator Guide.
An account is either an Admin, which carries full access to the interface and the configuration, or a User. API access is granted per account on the Permissions tab.
Build a host list under Admin > Management > Host List Management and assign it to an account, and it acts as a whitelist on every dashboard that account views and every query alert it creates. Administrators and API accounts operate outside these restrictions, so treat host visibility as a way to keep teams focused on their own systems rather than as a security boundary.
Local accounts, or Active Directory and LDAP with SSL or TLS to the directory server. Users import from a directory, with search and pagination on the import page.
Log Server keeps an audit log of activity in the interface, which administrators can filter. It carries across when you migrate a cluster to a new release.
| Item | Details |
|---|---|
| Interfaces | Web interface plus a REST API, with API access granted per account. |
| Licensing | Per instance and perpetual, with no charge tied to the volume of data you ingest or how long you keep it. |
| Trial | 30 days with the full feature set, installed on your own server. A license key converts a trial deployment without reinstalling. |
| Maintenance & Support | Optional annual Maintenance & Support covers software updates and case support. |
Buy it once, per instance, with no charge for the volume you send it. The first year of Maintenance & Support is included, and renewing keeps updates and support active.
One instance. Nagios does not recommend it, and offers it for teams who have weighed the trade-off.
Three instances or more, which is where replicas have somewhere to live and failover works.
Ten instances or more, for substantial daily volume with indexing and search split across the cluster.
* Limits depend on the hardware you provide. Nagios places no arbitrary limit on retention or user count, and licensing does not meter the volume you ingest. Not sure which plan fits? The Log Server Plan Calculator sizes it from your daily log volume.
Yes, and that is the default configuration. The syslog input listens on TCP and UDP port 5544 and accepts data from Linux and UNIX hosts, macOS, switches, routers, firewalls, and VMware ESXi. Traffic can be encrypted with SSL or TLS.
Server log analysis is reading what your servers wrote, across all of them at once, to explain something that already happened. Collection gets the logs into one place. Analysis is the part where you filter to the minute either side of an incident, rank the hosts or programs producing the most of something, and turn the search that explained it into an alert so the next occurrence finds you.
Per instance and perpetual, with no charge tied to the volume of data you ingest or how long you keep it. Optional annual Maintenance & Support covers software updates and case support. Pricing by instance count is listed on this page, and the Log Server Plan Calculator works through sizing.
Three is the recommended minimum, because replica shards need somewhere to live for redundancy and failover to work. Size beyond that on daily log volume and retention period. A single-instance license is available for deployments that accept the loss of redundancy deliberately.
It depends where you start. Log Server 2024R2 replaced Elasticsearch and Kibana with OpenSearch and a new dashboard engine, and 2026R1 moved OpenSearch to 3.1.0 and Logstash to 9.1.1. An in-place upgrade to 2026 from a version older than 2024R2 is not possible, because the index format changed.
Stand up a new 2026 cluster instead and run the migration script, which reindexes log data and carries across alert queries and history, dashboards and reports, Logstash configuration, email templates, host lists, NRDP servers, SNMP trap receivers, LDAP certificates, and the audit log. The source cluster must be at 2024R1.3.7 or later. From 2024R2 onward, upgrade in a rolling fashion, one instance at a time, until every member is on the same version.
No agent from Nagios, on any platform. Linux and UNIX use the rsyslog or syslog-ng daemon already running, and network devices and appliances use the syslog export already built into them. Windows is the exception, and it is not a Nagios agent either: you install NXLog Community Edition, a free lightweight forwarder, point its nxlog.conf at your Log Server address, and start the service.
Anything that can send syslog over TCP or UDP, forward Windows Event Logs through NXLog, write to a file the server can read, emit SNMP traps, or post JSON, which has its own input out of the box. Guided setups cover Linux, Windows, VMware ESXi, macOS, Apache, MySQL, and Nagios Core. Custom formats are handled by writing a filter to extract the fields you need.
No. It is a log management and analysis platform. It centralizes, indexes, searches, retains, and alerts on log data, which is the foundation a security workflow is built on, and it is frequently run as the log layer alongside dedicated security tooling. Correlation rules, threat intelligence, behavioral analytics, and automated response are a separate category of solution.
Yes. Configure an NRDP notification method in Log Server and point it at your Nagios XI or Nagios Core server with a matching token. Nagios XI ships with NRDP already installed. Log conditions then appear as passive Services and follow the same notification, escalation, and reporting rules as everything else you monitor.
On the disks of the instances in your cluster, and in the snapshot repository you point at your own NFS or CIFS share. Nothing is sent to Nagios. The one exception is Natural Language Queries, which is off by default and sends query text to OpenAI using an API key you supply.
It depends on your environment, and there is no single number that fits every install. Three things drive it: how many log entries per day your sources send, how long you keep each day's index open before closing or deleting it, and how much you snapshot to the repository.
Closing an index is worth understanding here: it frees the memory and query load that index was using, but the data stays on disk, so closing manages performance rather than capacity. Only deleting or snapshotting and then deleting reclaims space. The published guideline is 1 TB per instance as a minimum. If you know roughly how much you expect per day, email [email protected] and we can size it with you.
Yes. Nagios Log Server includes a fully functional 30-day trial with Enterprise support, installed on your own server.
Install Log Server on a server you control, point your first source at it, and run a query against a week of your own data. Start your free 30-day trial today!