Every Nagios XI feature, in one place

What XI collects, how it decides something is wrong, who it tells, and what it records. Grouped the way monitoring actually works, with the edition each feature needs.

A Nagios XI Smart Dashboard with graph, gauge, treemap, and alert heatmap dashlets

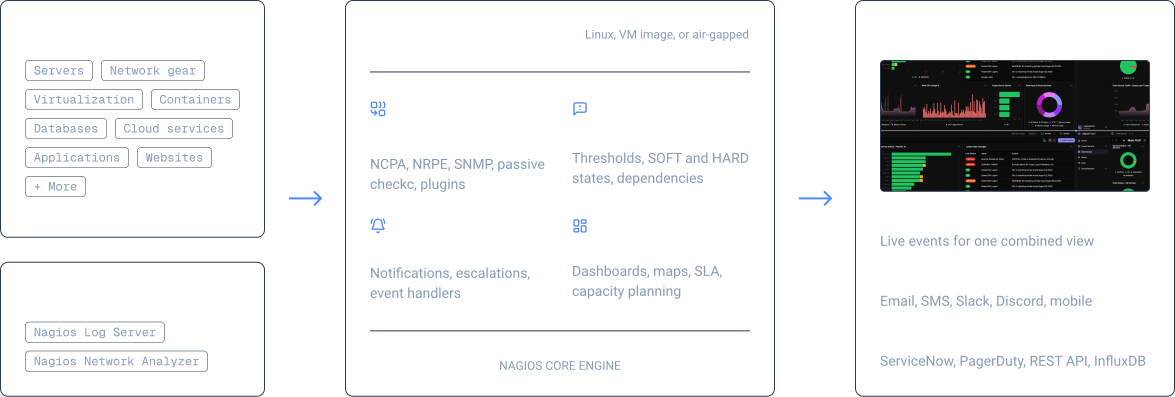
How Nagios XI fits together

Everything runs on one server you own. Data comes in, XI decides what matters, and the right people and tools hear about it. Select a stage to jump to its features.

how nagios xi fits together graphic 1
Stage 1 of 5

Collect

Get data in from everything you run, with or without an agent.

Data collection

Agents, agentless protocols, and pushed results, all on one XI server.

  • Nagios Cross-Platform Agent (NCPA)

    One token-authenticated HTTPS agent for Linux, Windows, macOS, Solaris and AIX. check_ncpa is a compiled C binary since 2026R1.7.

    The NCPA web interface listing available metrics on a monitored machine
  • NRPE and NSClient++

    Existing agents work as-is and sit beside NCPA hosts in the same views.

  • SNMP v1, v2c, and v3

    Polling and traps. The SNMP Walk wizard groups OIDs by interface or MIB.

  • Agentless checks

    WinRM, SSH, ICMP, TCP, HTTP, and DNS for devices that can't run an agent.

  • Passive checks

    NRDP and NSCA accept results over ports 80 and 443 with a token per sender.

  • Unconfigured Objects

    Passive Results from hosts XI doesn't know yet are held so you can adopt them.

  • Custom plugins

    Any script that returns an exit code is a plugin. The Generic Plugin Wizard wraps it.

Stage 2 of 5

Detect

Decide what counts as a problem, and ignore what doesn't.

Problem detection

Every check returns OK, Warning, Critical, or Unknown against ranges you set.

  • Warning and Critical ranges

    Thresholds per check, so a disk at 85% and one at 98% are different events.

  • SOFT and HARD states

    A check fails a set number of times before anyone is notified.

  • Dependencies and parents

    Hosts behind a failed router are marked unreachable instead of paging separately.

  • Deadpool

    Enterprise

    Objects stuck in a problem state past your limit are moved aside.

  • Capacity Planning

    Enterprise

    Projects performance data forward and can alert on the predicted value.

  • Flap detection

    Services bouncing between states are flagged and their notifications held.

Stage 3 of 5

Act

Reach the right person, fix what can be fixed, and hand the rest to your tools.

Alerting and remediation

What happens after a HARD state change is configurable at every step.

  • Event handlers

    Run a script on a state change, such as restarting a service, before anyone is paged.

  • Notification channels

    Email with Microsoft OAuth2, SMS via Twilio or a Multi-Tech modem, Slack, Discord, and SNMP traps.

  • Bulk notification settings

    Enterprise

    Change how, when, and for what events notifications will fire for groups of users.

  • Escalation Wizard

    Tiered escalations per host, service, or group when nobody acknowledges.

  • Acknowledgements and downtime

    Repeat notifications stop once a person owns the problem.

  • Rapid Response links

    Acknowledge straight from the link in a notification.

  • Time periods

    Each contact is only notified inside the hours they're on call.

The notification path
  1. Check resultCompared with Warning and Critical ranges
  2. HARD StateAfter the retry count is used up
  3. Event handlerRestarts the service or clears the disk
  4. Contact notifiedInside their time period only
  5. EscalationNext tier if nobody acknowledges
Stage 4 of 5

See and prove

Give every team its view, and keep the evidence for every report.

Dashboards and maps

Build the view each team needs and put it on the wall.

  • Smart Dashboards

    Variety of dashlet types, from graphs and gauges to treemaps and alert heatmaps.

  • Shared dashboards

    Deploy to other users, publish globally, set as a home page, import and export.

  • Performance graphs

    Built automatically from check data. Graph Explorer stacks hosts and exports CSV.

  • Network Status Map

    Draws the parent-child topology on its own. The World Map places hosts by location.

  • NOC wall Views

    Rotate dashboards, maps, and URLs on a timer, with Automatic Login for kiosks.

Stage 5 of 5

Platform

Run it where you want, at the size you need, with the controls auditors ask about.

Scale

A standard unlimited-Node instance handles roughly 10,000 to 20,000 checks at a five-minute interval.

  • Centralized

    One XI server for configuration, alerts, and reports.

  • Federated

    Site servers forward results to a central XI server through NRDP or NSCA.

  • Mod-Gearman remote workers

    Workers pull checks from a queue on port 4730, so remote sites need no inbound access.

  • Nagios Fusion

    One view across many XI servers, with live events from 2026R2.

What each edition includes

Both editions are perpetual and priced per Node, with unlimited Services. Enterprise is also an add-on to any Standard license.

Full edition comparison
FeatureStandardfrom $2,595Enterprisefrom $4,690
Wizards, Auto-Discovery, dashboards, graphs, REST APIIncludedIncluded
Configuration snapshots and rollbackIncludedIncluded
Availability, bandwidth, and executive summary reportsIncludedIncluded
Scheduled reports and scheduled pagesNot includedIncluded
Service-Level Agreement (SLA) reportNot includedIncluded
Capacity PlanningNot includedIncluded
Advanced Business Process MonitoringNot includedIncluded
Bulk modification, renaming, and notification settingsNot includedIncluded
Audit Log and DeadpoolNot includedIncluded
SNMP Trap InterfaceNot includedIncluded

Prices for 100 Nodes. Premium features (single sign-on, Remote Workers, Wizard Builder, and premium wizards) need active Maintenance & Support on either edition. Sitewide licenses include Enterprise features and Nagios Fusion.

Access Nagios Downloads

We will email your download access link.