Now you can monitor with Prometheus Node Exporter metrics directly within Nagios XI. The Nagios XI Prometheus Wizard makes it easy to track exporters, scrape targets, and key metrics—no PromQL required.
This premium feature allows for thousands of metrics to be monitored.

Prometheus handles metrics collection effectively for containerized environments, Go applications, and cloud infrastructure, but alerting capabilities lag behind enterprise requirements. Nagios XI bridges this gap with advanced alerting intelligence, workflow automation, and comprehensive infrastructure monitoring across your entire technology stack.


Modern infrastructure demands comprehensive visibility. While Prometheus excels at metrics collection and Nagios XI delivers enterprise-grade monitoring, combining them creates an unbeatable monitoring powerhouse. Bridge the gap between time-series data and intelligent alerting to achieve complete operational awareness across your entire technology stack.
Transform fragmented monitoring into a unified command center. Collect 30+ major categories spanning infrastructure, applications, and hardware – from CPU and memory to network performance and security state.

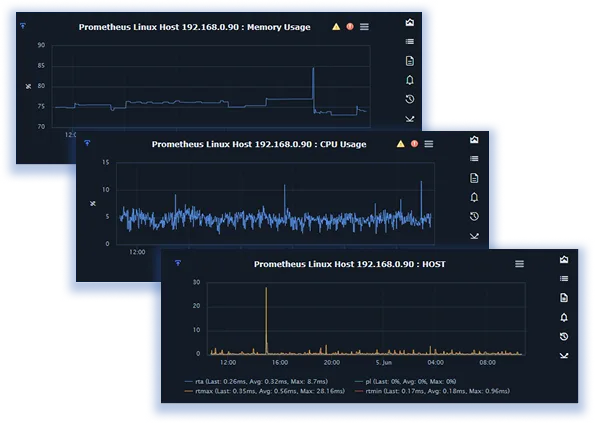
See exactly how your systems perform with metrics like CPU utilization, memory allocation, network throughput, and garbage collection timing – all updated continuously with no setup overhead.
Enterprise-grade reliability proven in production. Achieve 99.9%+ collection success rates while efficiently processing comprehensive system metrics with minimal resource overhead.

Learn how to integrate Prometheus’ powerful time-series monitoring with Nagios XI’s flexible alert system. This guide walks you through setting up the Linux and Windows Exporters to enable you to access, monitor, and alert on Prometheus data in Nagios XI.
Discover how Nagios XI’s Prometheus Wizard simplifies real-time performance monitoring setup. Learn to configure hosts, select monitoring services for CPU, memory, and disk usage, and leverage intuitive tools for efficient infrastructure oversight.

This guide covers installing the Prometheus Windows Exporter, configuring monitoring with Nagios XI, setting CPU and memory thresholds, and managing notifications for infrastructure monitoring.
Experience the power of Nagios XI with Prometheus integration. Start monitoring your infrastructure with our comprehensive solution.


