New technologies that need to be monitored are constantly coming onto the market; organizations are scaling up and down; and infrastructure is becoming more complex overall. With so many factors, it can be easy for system administrators to see each challenge as an item to quickly check off the list and move on, but this mentality fails to put out the fire at its source.
Falling into the following IT monitoring traps can result in other problems and missed opportunities further down the road. Are you struggling with any of these pitfalls? Let’s take a look.
Failing to See the Big Picture
One of the biggest mistakes people make is only using IT infrastructure monitoring to answer the question, “Is my device working?” which doesn’t take the bigger picture of what is going on into account. To avoid this pitfall, organizations should use IT monitoring to inform their critical business decisions. Monitoring provides insights and data that they can use to make decisions about scaling the organization up or down, strategic objectives around acquisitions, and how best to meet customer expectations.
For example, let’s say you have 10 servers on a server rack that load and run your website. Your monitoring software tells you that the servers are hitting capacity on a regular basis. By looking at the big picture, you can see this is happening because your website is getting more traffic than it used to, and with that information, you can make a more educated decision about adding more computing resources to ensure the website functions properly. Perhaps there’s even a case to be made for further expanding your hardware or other infrastructure in the future based on the information gathered from monitoring.
Ignoring Your Logs
Another common mistake that we see people make is overlooking the importance of monitoring log data. A log aggregation platform can collect and help you analyze log data, which is important for challenges like identifying security risks, troubleshooting problems, and staying in compliance. Gathering log data is like an insurance policy: you might not use it in your daily work, but when there’s a significant risk or problem, it can be your saving grace—especially when the average cost of a data breach can be hundreds of thousands of dollars!
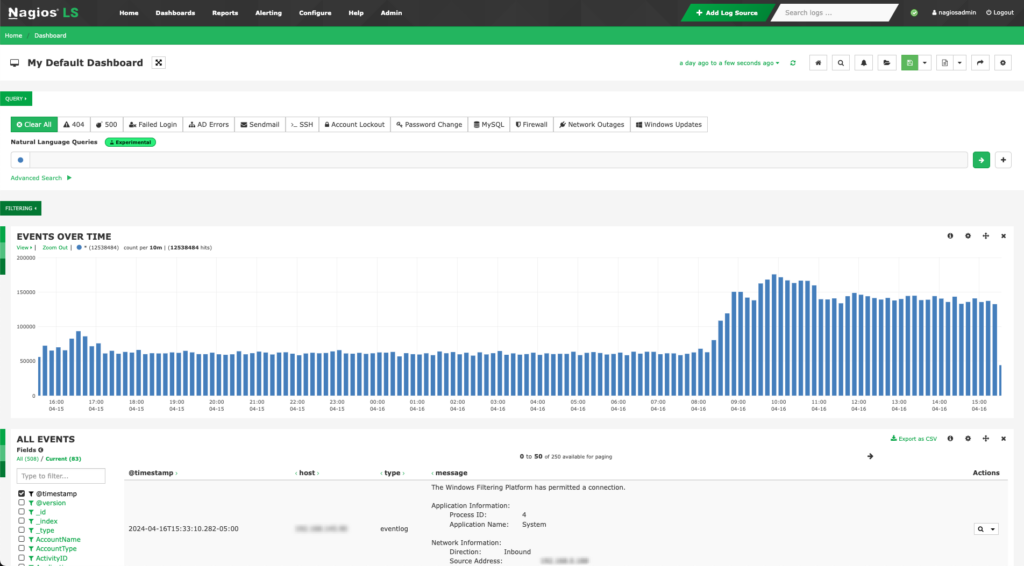
If your infrastructure crashes, having data from the events that led up to the crash can help identify the problems much more quickly and accurately. Without the log data, system administrators start out at a deficit when trying to identify the cause of a problem. Here at Nagios, we’ve seen this scenario play out many times with our clients. A customer heard about Nagios Log Server and implemented it over the weekend. By Monday morning, he saw 15,000 failed password attempts from an unknown location. If he hadn’t started monitoring his logs, he wouldn’t have had any idea this was happening! He could’ve lost company secrets, customer data, and potentially his entire livelihood if one of those attempts had been successful.
Alerts That Cry Wolf
Alert blindness happens when administrators or users get so many alerts from their IT infrastructure monitoring software that they start ignoring them. It’s a case of your monitoring software crying wolf so many times that you ignore it—even when there is a wolf at the door.
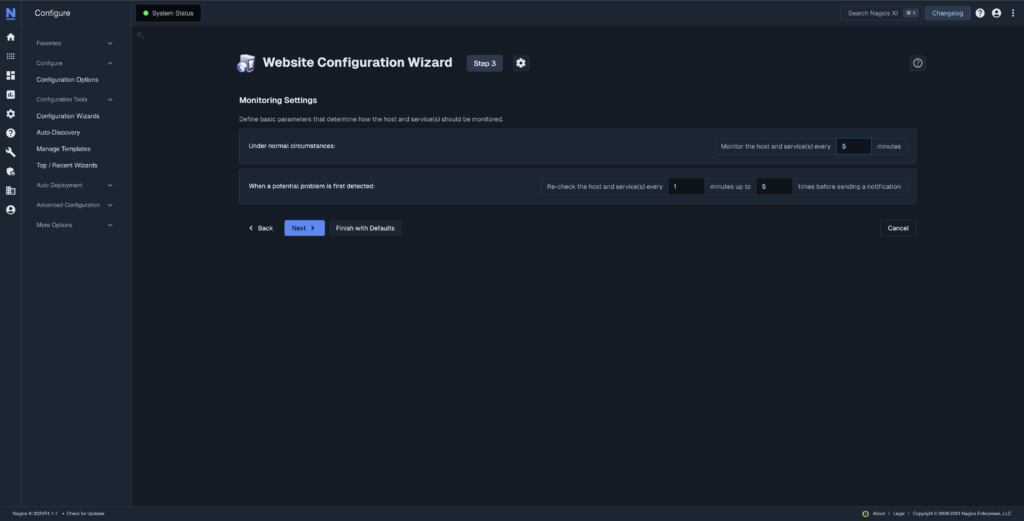
Instead, your IT infrastructure monitoring vendor can help guide you through setting up notification thresholds that prioritize what’s important to you. For example, your software can run recheck intervals when a threshold is reached to make sure that the problem is a recurring issue and one that requires your attention, not just a blip caused by an app download or a momentary spike. With recheck intervals, you’re only notified of issues that are ongoing and don’t fix themselves after a set period of time.
Another way to cut down on the avalanche of alerts is to create a script or command that automatically responds when a device isn’t working properly. For example, if your organization’s website freezes, your IT infrastructure monitoring software doesn’t have to send you an alert right away. The first thing it will do is run a script to call out to that server and tell it to restart. Once the restart is complete, the software will then check to see if the restart fixed the problem. If it did, great! You won’t get an alert. But if the restart does not fix the problem, it will issue a notification so that the problem can be addressed. Solving problems with automation instead of human involvement saves everyone time and improves the speed and productivity of your entire IT infrastructure.

Distracting, Siloed Monitoring Systems
If you have separate solutions for database monitoring, server monitoring, and web monitoring, you’re dealing with a lot of different software, screens, and data just to get a decent understanding of your IT infrastructure. With so many siloed inputs, you might be distracted from seeing the important information—or at least not able to aggregate and analyze the information in a way that helps you make better decisions about your IT infrastructure.
Consider utilizing monitoring software that can give you a clear view of your entire infrastructure in one centralized location, like Nagios Fusion. You should be able to write your own scripts and connect to anything using the common language of a device or application if the monitoring solution doesn’t already support it. A flexible IT monitoring solution is especially important as the IoT market grows and devices diversify because the solution will be able to monitor anything you bring on board. This kind of monitoring solution will be able to monitor what you need it to through utilizing tools such as SNMP and plugins. If an IT monitoring solution can’t monitor everything you need, all in one place, you risk relying on the vendor’s internal monitoring solution, which creates more silos of data.
No monitoring solution can foresee everything that may connect in the future, but if it gives you the freedom to connect anything on your own, you can be confident that the IT infrastructure is future-proofed as your organization evolves.
Understanding the ‘Why’
By addressing these common pitfalls, you can better understand the ‘why’ behind the workings of your IT infrastructure: why some thresholds are being missed, why websites are freezing, why the customer experience isn’t up to par, and so on. Rather than dealing with each fire as it comes, you can put out some of those fires at the source and refocus your talents on other projects and objectives.
One of XI’s built-in reports in the Enterprise Edition is the Capacity Planning Report, which takes historical performance data through a number of extrapolation methods to predict when devices will hit a certain threshold. For example, you can use the Capacity Planning Report to predict when a server’s hard drive will fill up. By anticipating this, you can reduce the amount of downtime that results from devices malfunctioning when they reach critical levels.
Ready to try Nagios?
Download a 30-day free trial of Nagios XI or any of our other solutions on our website.