Nagios monitors networks, servers, applications, and cloud infrastructure, analyze traffic flows, and centralize logs across every site, without your data ever leaving your network.
Trusted by 10K+ Teams Worldwide


The Nagios ecosystem is a set of self-hosted IT infrastructure monitoring, network traffic analysis, and log management solutions. It spans open source and commercially licensed software, used to track servers, network devices, applications, and services. Each solution deploys standalone and exchanges data with the others through native integrations and REST APIs.


Set custom Warning and Critical values per Service, then escalate by notification count to wider contact groups.

Visualize & analyze your NetFlow, sFlow, J-Flow, and IPFIX records by source, port, and protocol, or capture packets.

Query and analyze every indexed source down to the exact log entry, then trace the traffic behind it.

Nagios Fusion polls every Nagios XI, Core, Log Server, and Network Analyzer server into one Tactical Overview.

Licensing is based on Nodes and Instances. Ingest volume, retention, users, and query load are never metered.

Runs on your servers, on premises or in your own cloud, and monitoring data stays inside your network.
Evaluate Nagios XI On Your Own Infrastructure
See why 10,000+ organizations worldwide monitor servers, networks, applications, and cloud with Nagios XI.
Each Nagios solution delivers deep visibility on its own. Connected together, they form a unified monitoring ecosystem that provides complete insight across infrastructure, networks, flows, and logs.
Infrastructure monitoring foundation. Monitor device health, service availability, and performance across servers, networks, databases, applications, and cloud platforms with active polling.
Get Started Free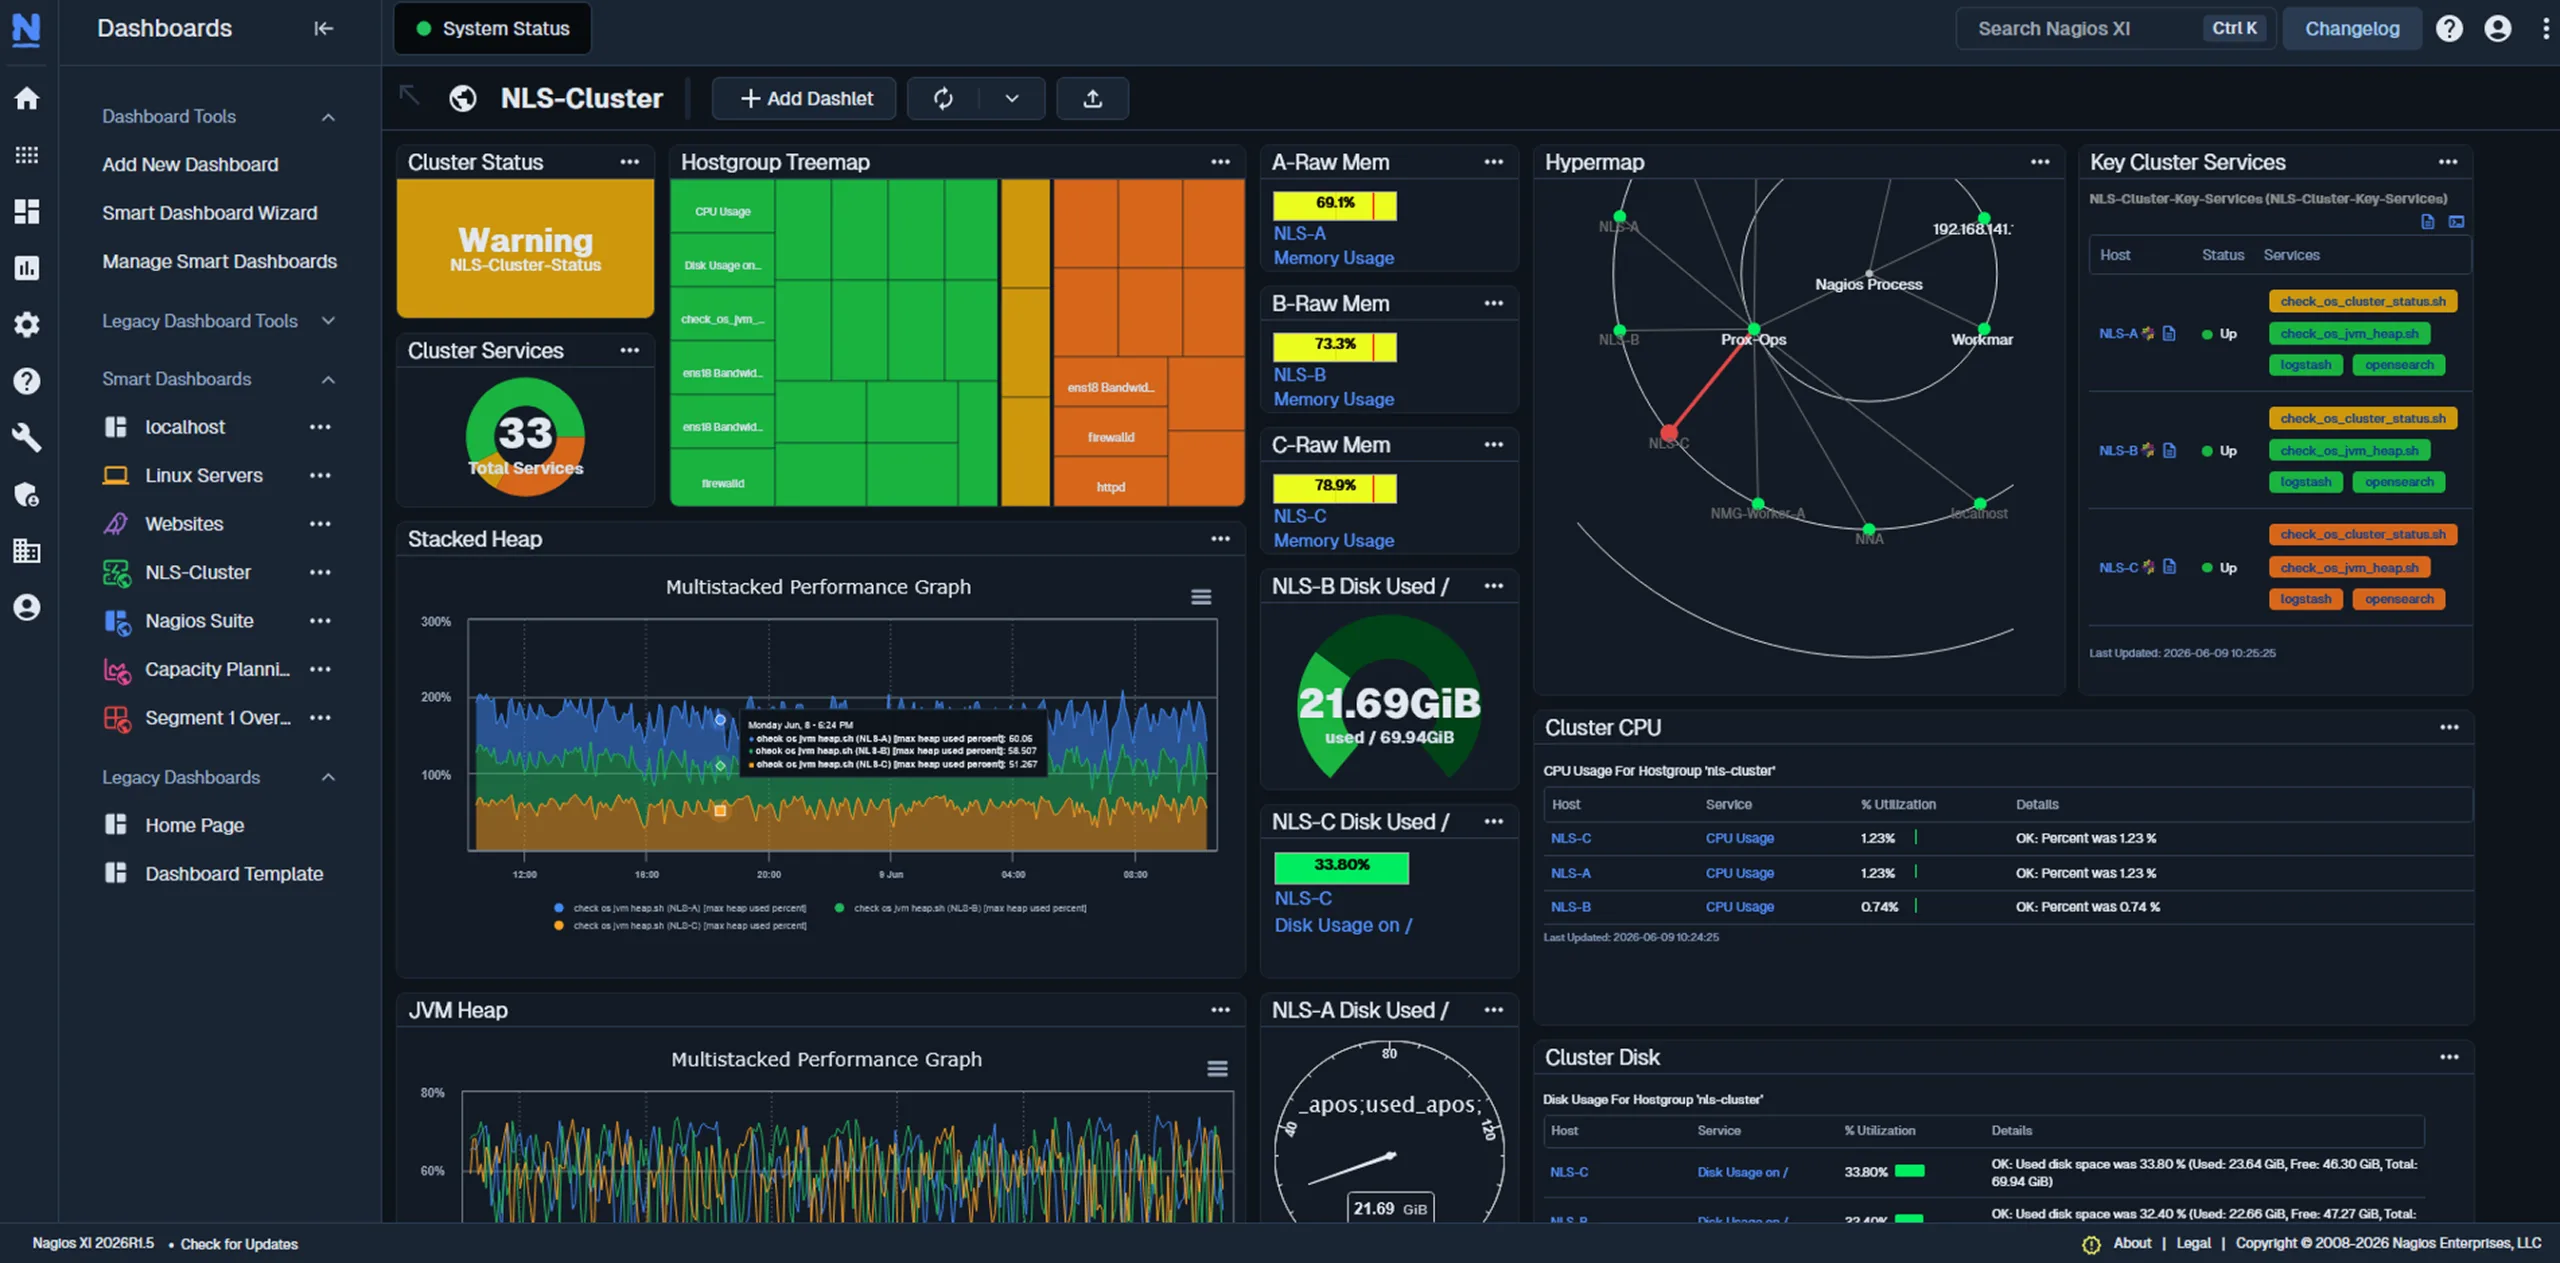
Deep traffic intelligence. Break bandwidth usage down by source and destination IP, port, protocol, and interface from NetFlow, sFlow, J-Flow, and IPFIX exports.
Get Started Free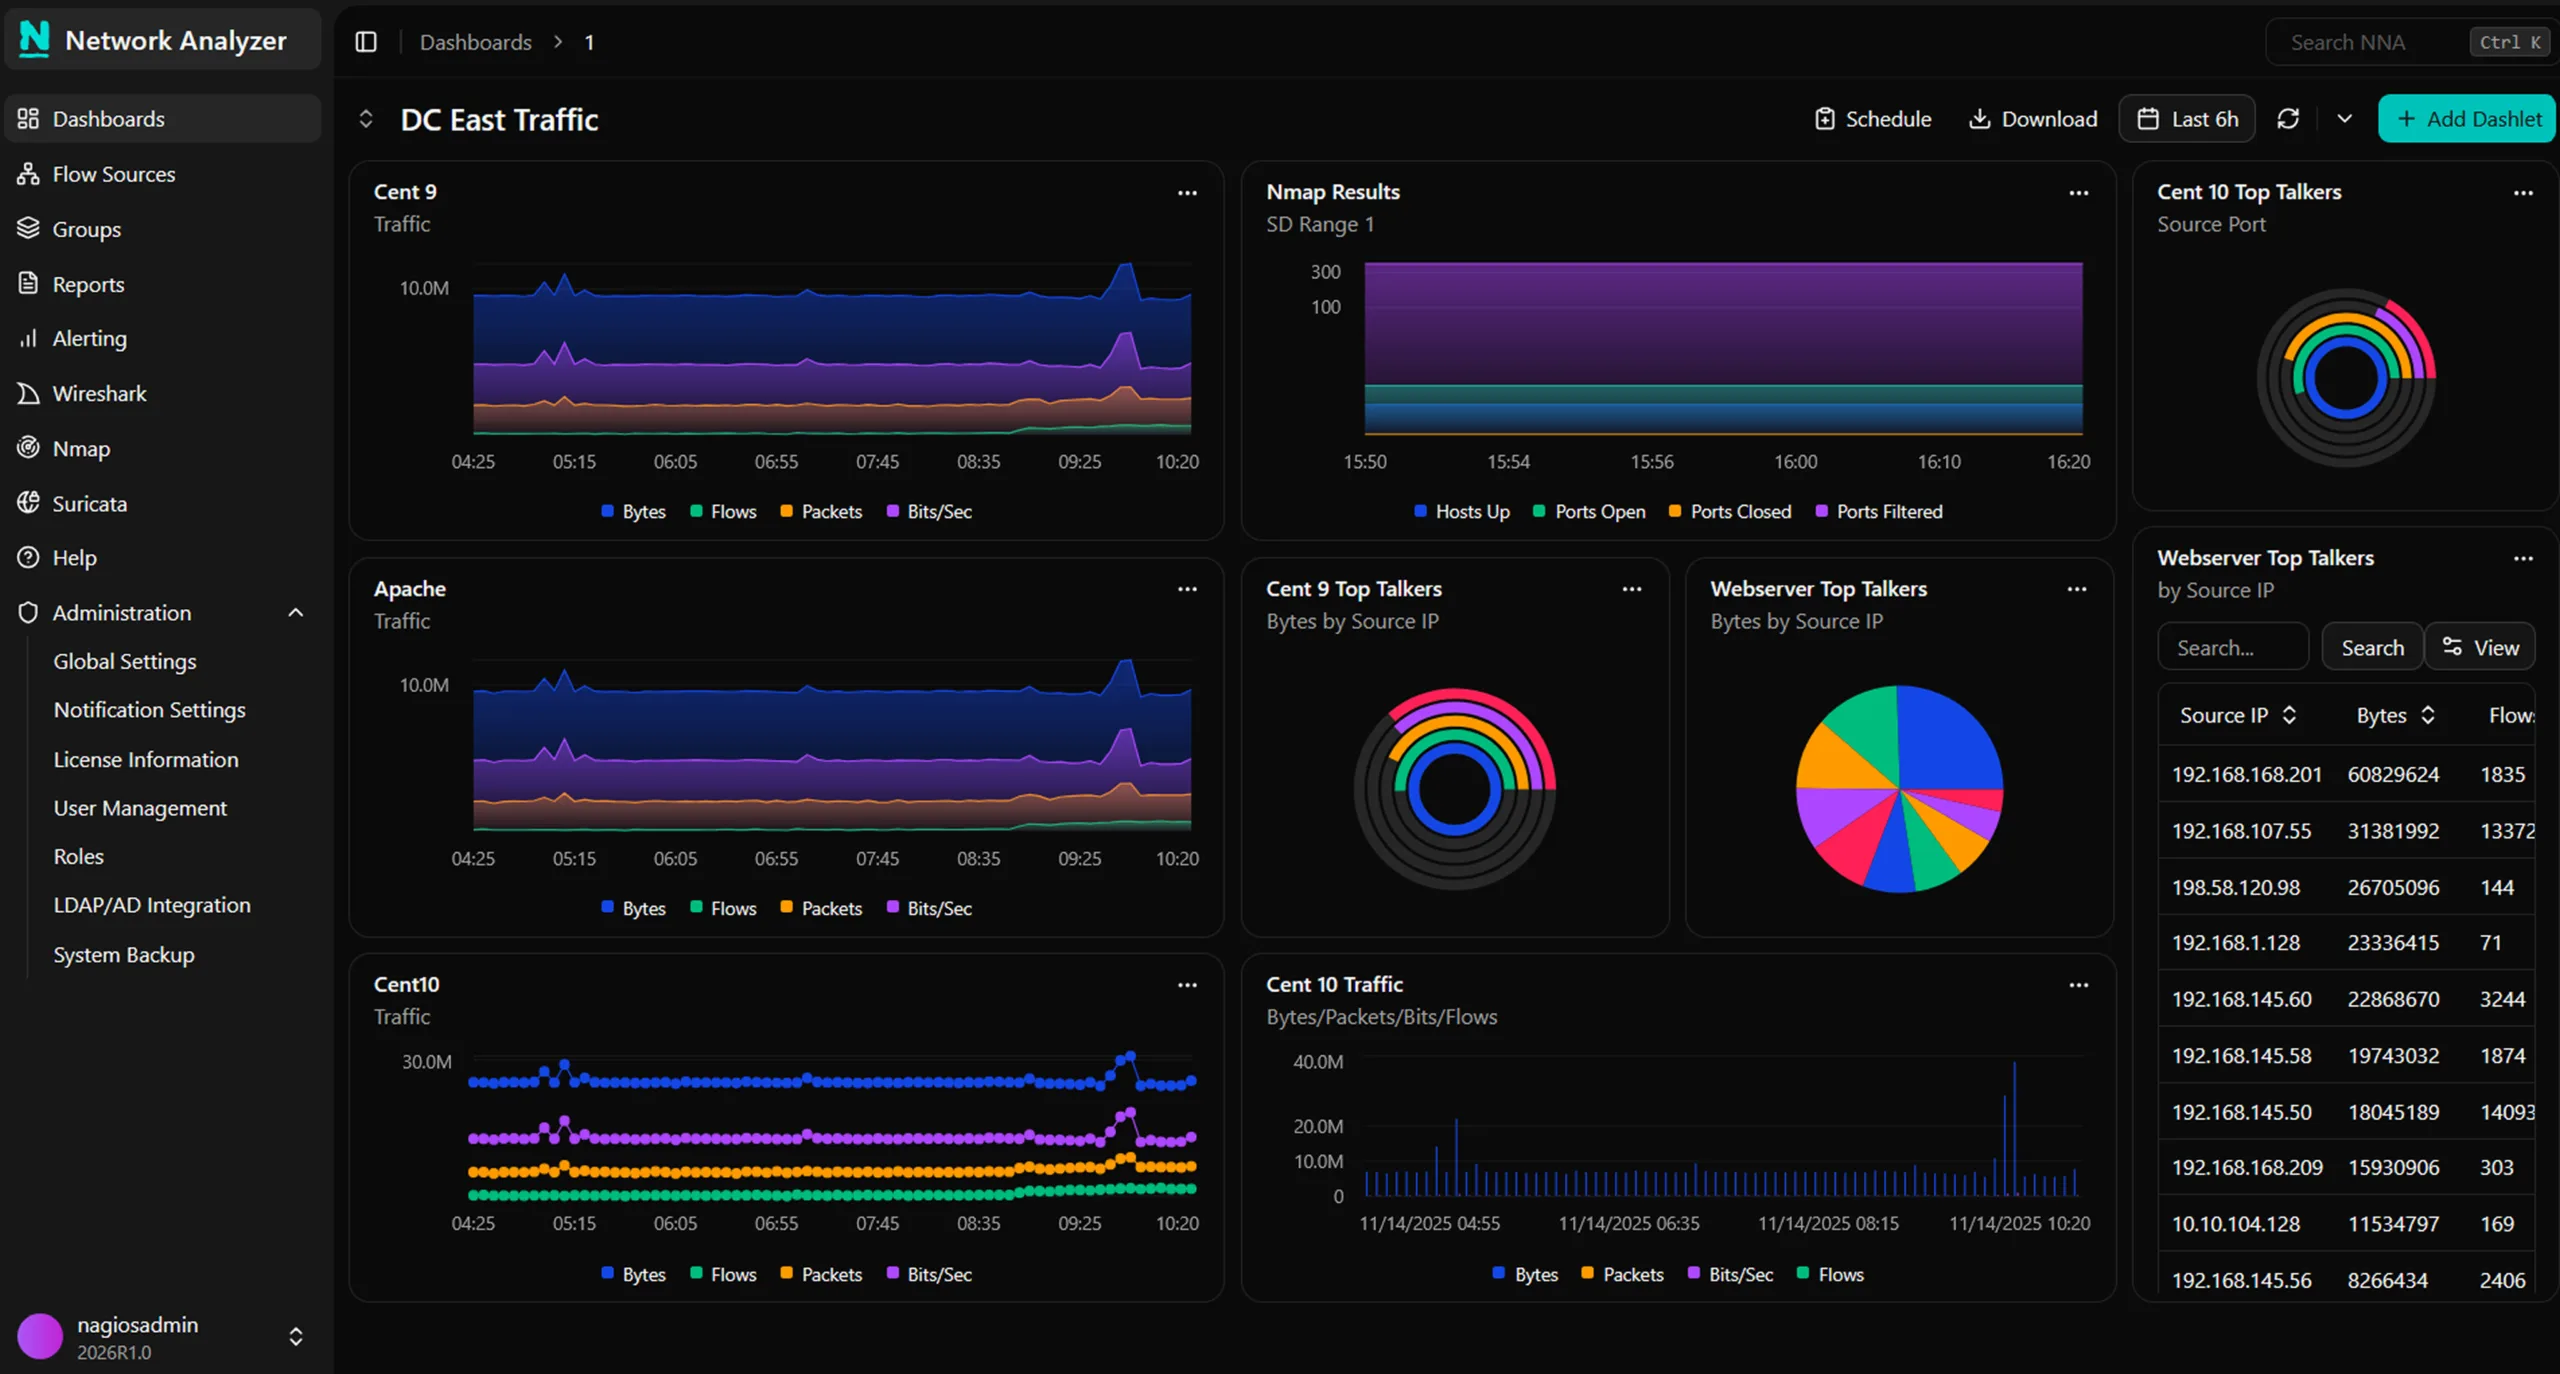
Incident response and log forensics. Collect syslog, Windows Event Logs, and application logs into one searchable cluster, alert on the patterns that matter, and keep the evidence as long as your retention policy requires.
Get Started Free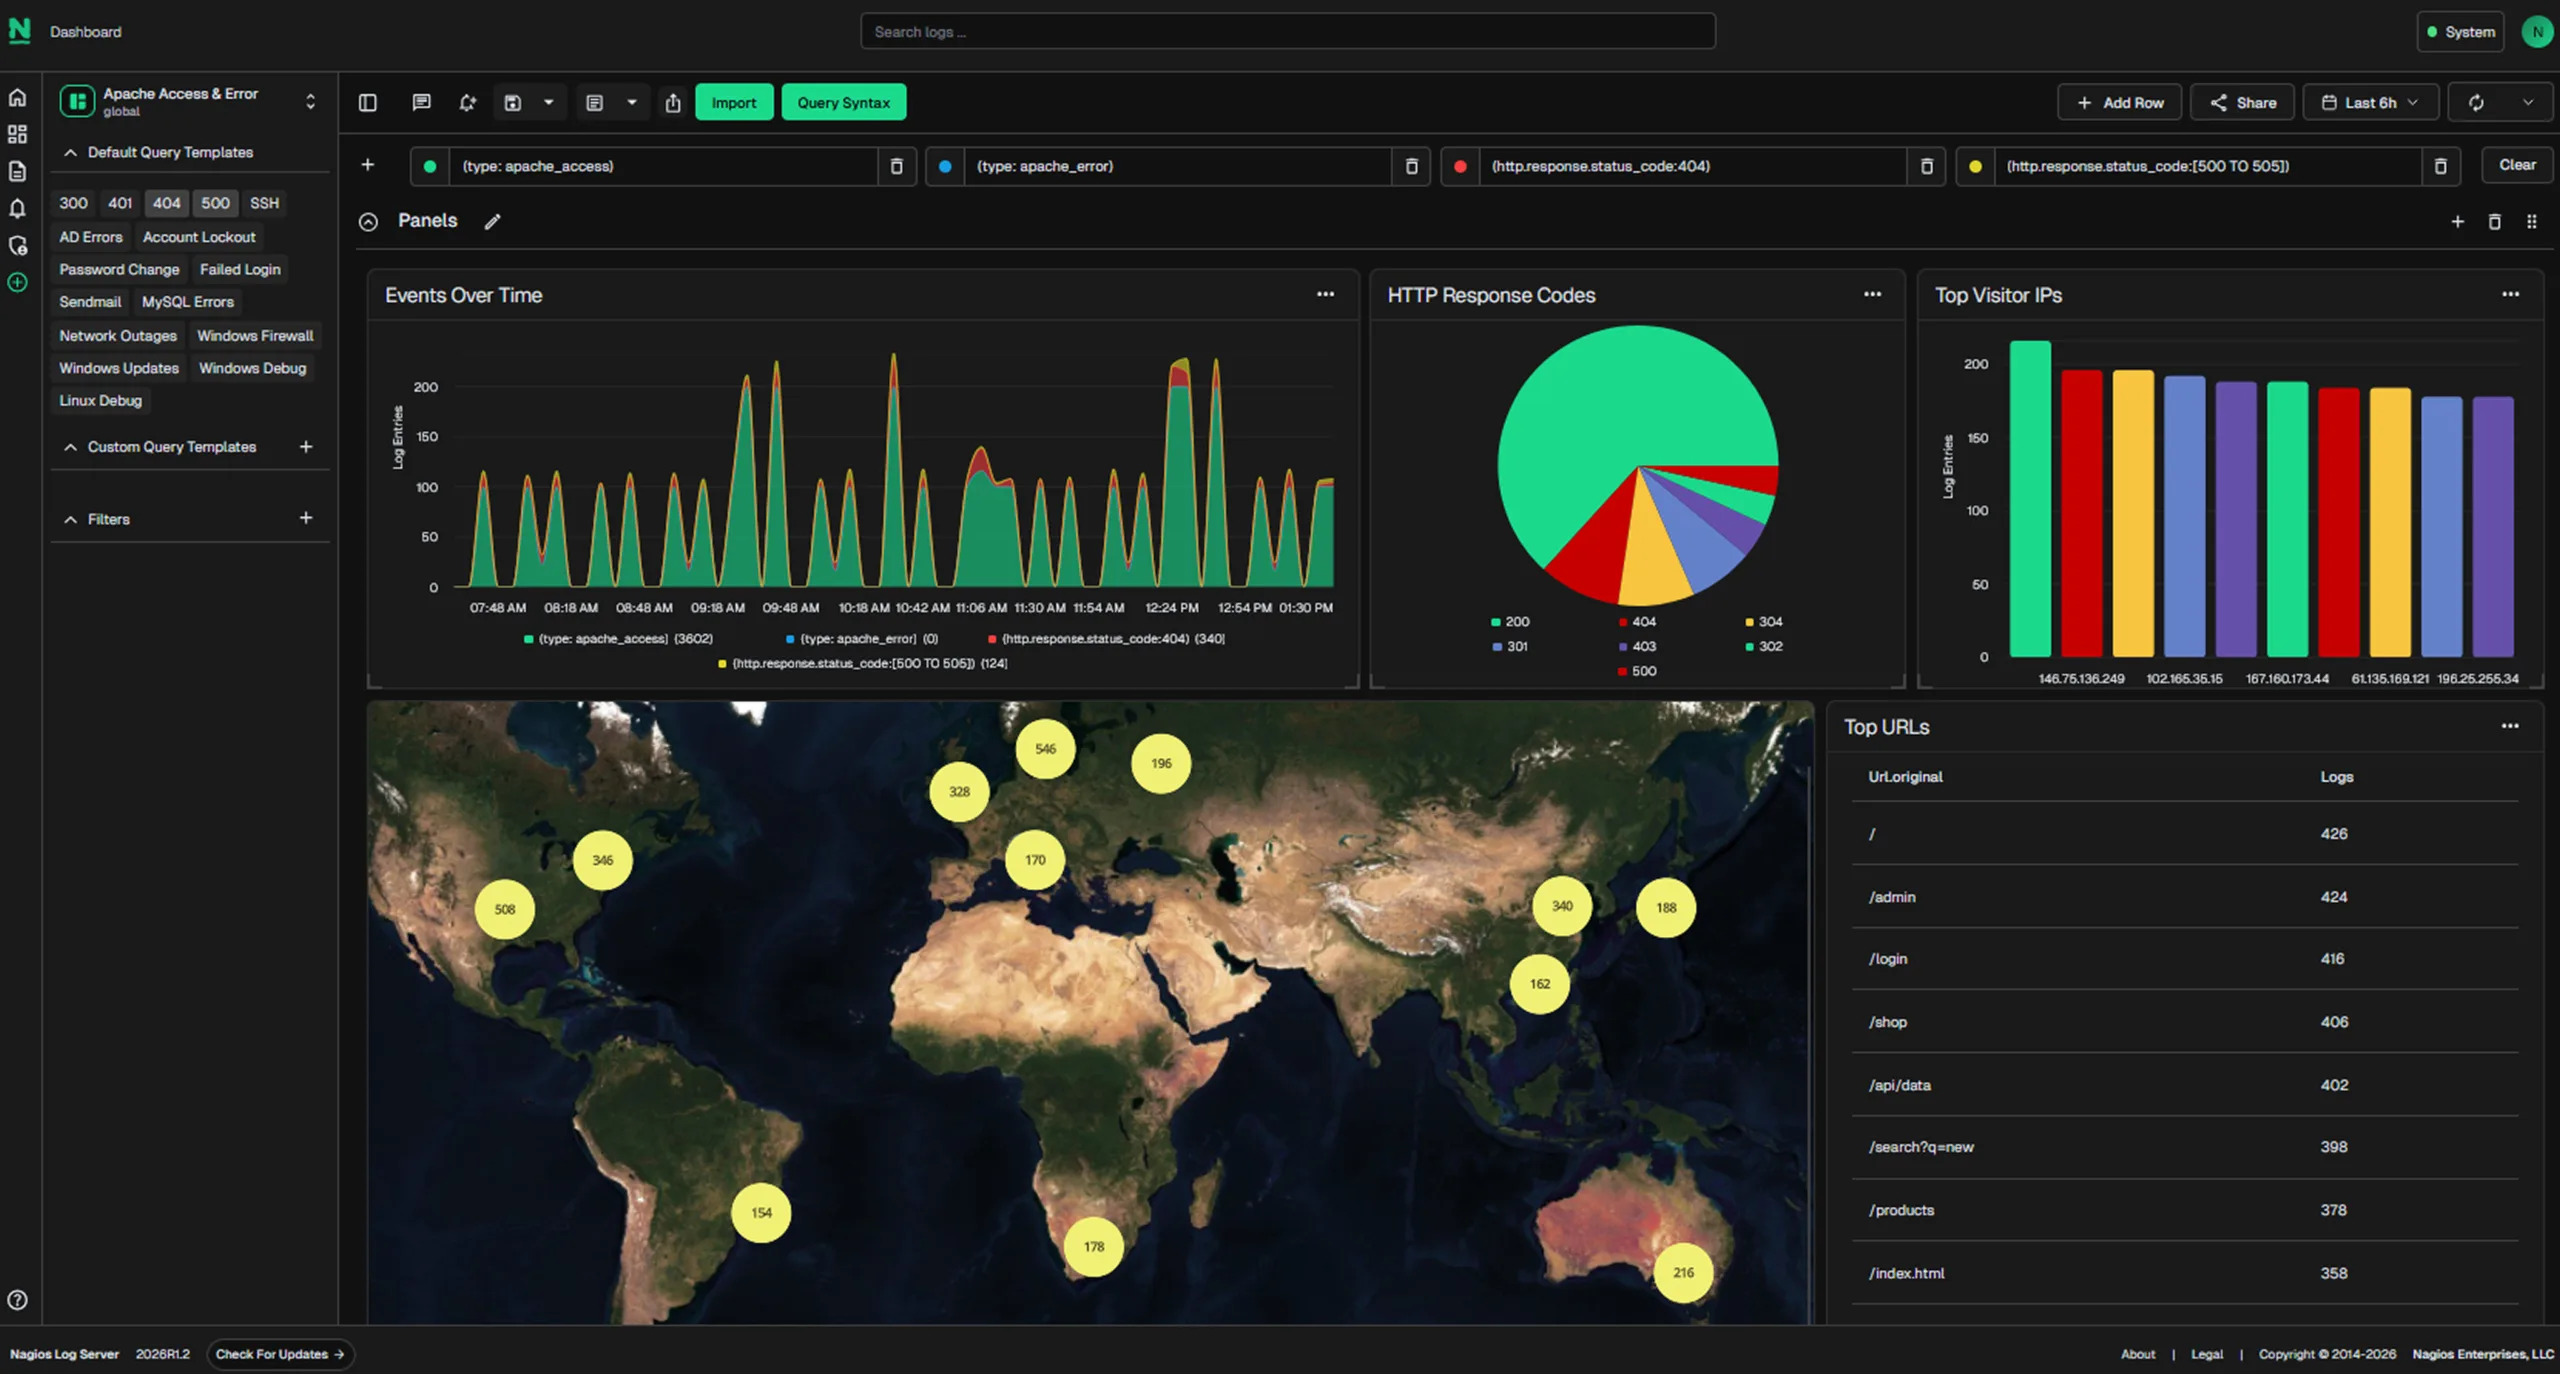
Fleet-wide visibility. Poll every Nagios XI, Core, Log Server, and Network Analyzer server into one Tactical Overview, while the monitoring itself stays on the individual servers.
Get Started Free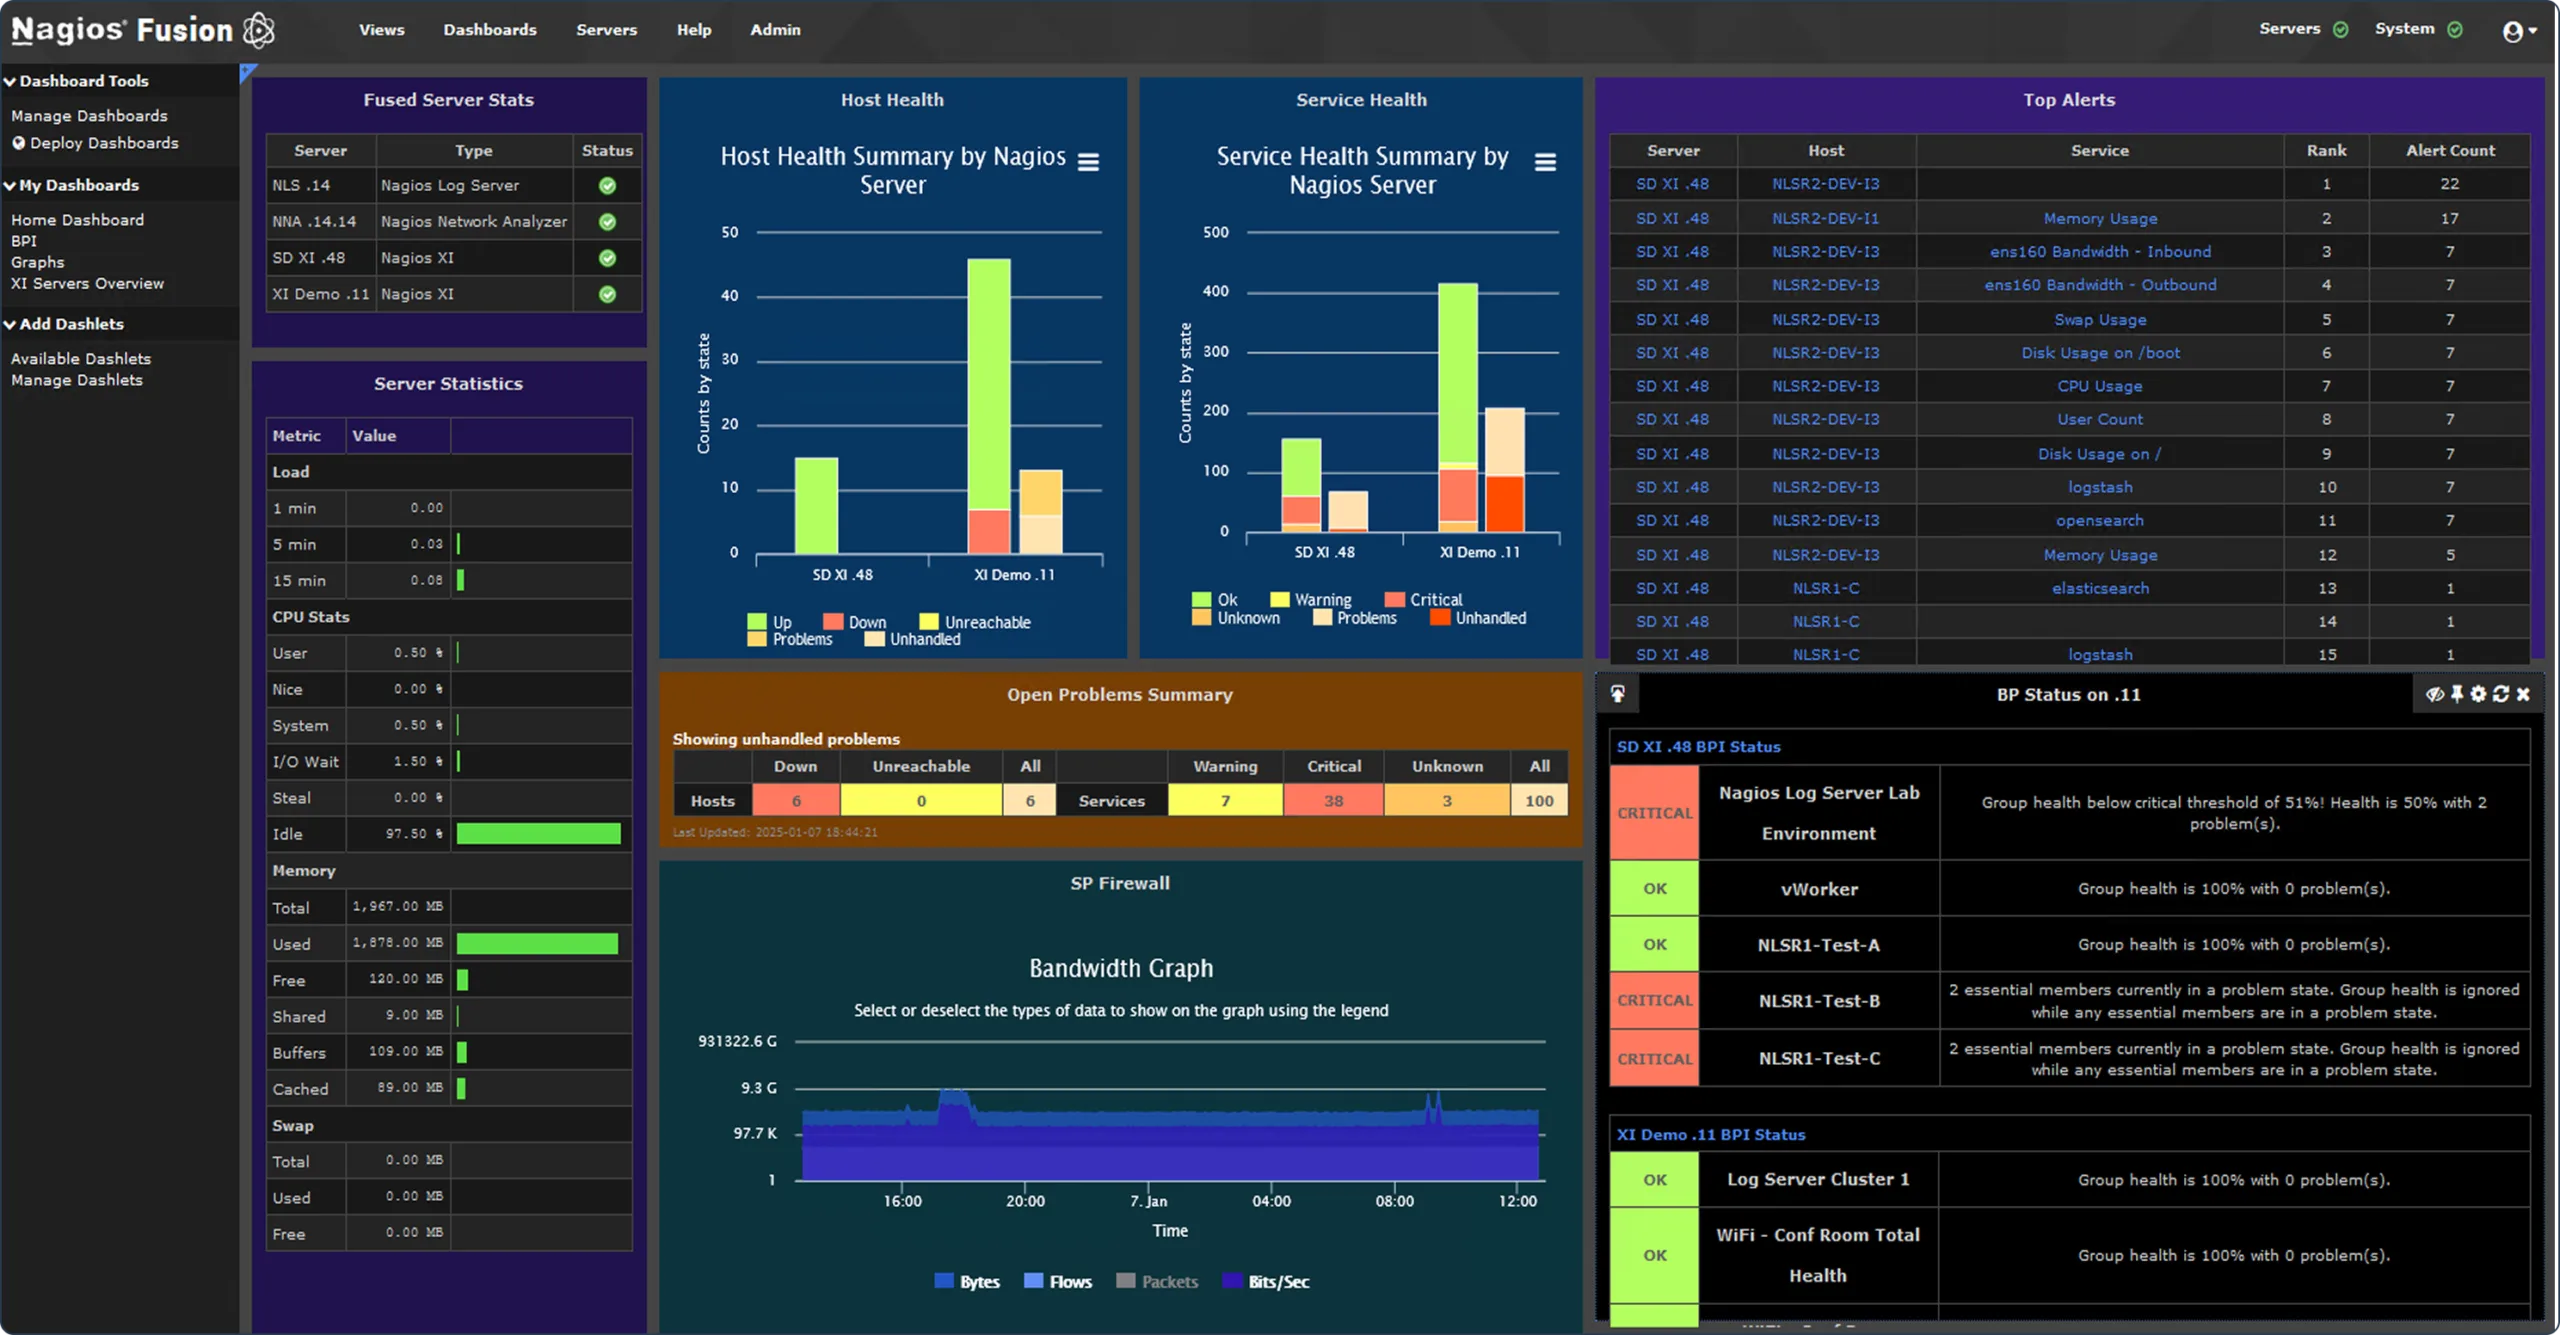
$2,595
Priced by Node count, up to site-wide licensing
$4,995
No user limit
$6,195
Priced by Clustered Instance, with no upper limit
$995
Add-on to the licenses you hold
Not Sure Which Plan Fits?
Nagios is self-hosted IT monitoring software. Nagios XI checks your servers, network devices, databases, applications, and cloud instances against thresholds you set, then notifies the people you nominate when a Host or Service changes state. It is built on Nagios Core, the open source monitoring engine. Three further solutions cover the data Nagios XI does not collect: Network Analyzer for network traffic, Log Server for logs, and Fusion for visibility across multiple monitoring servers. Each is its own application on its own server, licensed separately, and each integrates with Nagios XI.
Knowing a Host or Service broke before a user reports it, and knowing why. Teams use Nagios to track availability and performance across servers, network devices, databases, applications, and cloud instances, to route alerts and escalations to whoever owns the system, to analyze bandwidth and network traffic, to search logs during an incident, and to report on availability and service levels afterwards.
Nagios runs a check on a schedule you set. The check reaches the target through an agent installed on the host, such as NCPA or NRPE, or agentlessly over SNMP, WMI, SSH, or HTTP. Each check returns a state and its performance data, Nagios compares that against the Warning and Critical values you defined, records the result, and sends notifications that escalate by notification count. Event handlers can run a remediation script the moment a state changes.
Nagios Core is free, as are the NCPA, NRPE, NSCA, and NRDP agents and the Nagios Plugins, and all of them are free to use commercially. Nagios XI, Network Analyzer, Log Server, and Fusion are commercial solutions. Nagios XI includes a 30-day trial with no Node limit, plus a free license for non-commercial home labs, evaluation, and students.
Partly. Nagios Core, the monitoring engine, is open source, as are the NCPA, NRPE, NSCA, and NRDP agents and the Nagios Plugins. Nagios XI is built on that engine and is commercially licensed, as are Network Analyzer, Log Server, and Fusion. Checks written for the open source engine run unchanged on Nagios XI, so work done on Core is never stranded.
Nagios XI is the commercial monitoring solution built on the Nagios Core engine. Both run the same engine and the same checks. Core is configured in text files on the command line. Nagios XI adds a web configuration interface, Configuration Wizards, Auto-Discovery, dashboards and Views, graphing, availability and SLA reporting, a REST API, multi-tenancy, an integrated database, and commercial support.
Nagios XI is licensed by the number of Nodes, or Hosts, you monitor, and Log Server by Clustered Instance. Network Analyzer and Fusion each have a single license option. Ingest volume, retention, user counts, and query load are never metered. Current figures are on the pricing plans page, or write to [email protected] for a quote against a specific Node count.
Yes. The Nagios Toolkits package the three solutions most incident work runs through, Nagios XI, Network Analyzer, and Log Server. The Security Toolkit supplies the infrastructure telemetry a SIEM depends on: device state changes, flow records, and retained syslog. The Networking Toolkit covers device and interface monitoring, bandwidth analysis, and syslog read alongside your status history. Individual licensing is still available if you would rather add one solution at a time.
No. NCPA gives you the most detail on servers you control and is the recommended agent. SNMP, WMI, SSH, and HTTP checks cover network devices, appliances, and systems where you cannot install software.
No. Nagios XI receives SNMP traps and passive check results. Log Server is the solution that centralizes syslog and Windows Event Logs, indexes them, and keeps them searchable.
No. Log Server collects, indexes, searches, retains, and alerts on log data. It does not include correlation rules, threat intelligence feeds, behavioral analytics, or automated response. Teams use it as the searchable log repository behind an incident review and as the evidence source for an audit.
Yes. Offline installation and offline license activation are both supported, so a Nagios XI server can run with no route to the internet.
Hospitals, government agencies, banks, factory floors, and carrier networks all run Nagios. Find the environment closest to yours and see how teams there use it.
Live sessions, deployments from government to healthcare, and a free video library.
Feature walkthroughs, configuration deep dives, and best practices, with a Nagios engineer answering questions live.
See Upcoming WebinarsWhat organizations across government, finance, healthcare, and education monitor with Nagios, and what changed after.
Explore Case StudiesA free video library covering every Nagios solution, plus networking and monitoring basics for anyone getting up to speed.
Browse Video LibraryGet Started
Download Nagios XI free for 30 days, or have a dedicated Nagios engineer walk through what it would catch in your environment.


