The purpose of IT monitoring is to observe, receive alerts, and better understand your IT infrastructure. Customization is essential for this because it allows you to see more than just a screen full of irrelevant numbers and messy charts. It allows you to view what you want in the way that you want, when you want.
That’s why Nagios XI gives you the power to customize in the ways that are most beneficial to you. XI comes out of the box with several features for tailoring it to meet your needs, many of which are available in its Standard Edition. You also have the ability to extend the functionality of XI beyond these features through community-built add-ons. As a result, you can dictate exactly what’s monitored, how you monitor it, and how your data is presented.
Maximizing XI’s Customization
Many organizations have found success with monitoring what they need with the customization capabilities of XI. One of those organizations is the U.S. Liability Insurance Group whose infrastructure architect, John Kimmel, switched them from another big-name monitoring solution to XI. Kimmel found that while XI comes with many customizable features out of the box, a user can get even more out of the solution by tapping into its extensibility and flexibility.
“If you just use Nagios XI out of the box, you won’t be using it to its full potential,” Kimmel said. “If we never wanted to customize anything, we could’ve stayed with our old solution, but it wouldn’t let us do the job right.”
Kimmel explained, “There’s a small learning curve with Nagios, and then you can do things you could never do with another solution. Nagios is the framework that allows you to design or build whatever you want because the customization is the best in the world.”
Just like the U.S. Liability Insurance Group, organizations of any kind can customize XI to meet their monitoring requirements in a myriad of ways for a clear view of their entire IT environment, so nothing goes undetected. To meet those requirements, the primary ways you can customize XI is through what you monitor, how you monitor, and how you visualize monitoring data.
What Can I Monitor with XI?
One of the primary ways that you can tailor XI to suit your monitoring needs is through its ability to monitor nearly anything that runs on electricity. XI makes this possible not only through its extensible and flexible architecture but also through its many Configuration Wizards. These Wizards make it easy for end users to monitor new devices, services, and applications, such as servers, ping, web applications, and many other IT components with their simple point-and-click setup.
XI can go beyond monitoring just the most common IT elements, though. From monitoring conventional hardware items like switches and databases to more unconventional items like the temperature of your refrigerator, there’s a way to monitor it all with XI; the main thing you need to figure out is how to do it.
How Can I Monitor Anything?
There are a few ways that you can monitor a wide variety of things with Nagios.
XI supports the monitoring of any SNMP-enabled device, so one of the ways that you can monitor many things is by using SNMP. This protocol allows you to monitor thousands of different network devices and operating systems in real time with SNMP traps. This method of monitoring is helpful when passive checks are the only way that XI can retrieve data from a device. XI is then able to process real-time updates from the SNMP traps to give you a better understanding of what’s going on in your network.
Another way that you can monitor more with XI is by using it in conjunction with the Nagios Cross-Platform Agent (NCPA). NCPA is an agent that you can use to monitor Windows, Linux, and Mac servers. This agent provides you with the ability to view graphs of real-time server statistics, so you can monitor servers using the same agent regardless of the platform.
One of the main ways to monitor nearly anything in XI is to utilize Nagios Plugins. Saying you can monitor nearly anything with XI may seem like an exaggeration, but we don’t think it is when you consider that there are over 4,000 plugins and community-developed add-ons available on the Nagios Exchange.
By utilizing these tools, you can fully customize XI to monitor what you need. Whether you want to monitor vSphere or Minecraft, there’s a plugin for that. Even if you can’t find what you’re looking for, it’s also easy to create your own Nagios Plugin. For guidance on how to make your own plugin, we have Nagios Plugin Development Guidelines that you can reference.
Can I Customize How I Visualize My Monitoring Data?
After you’ve started monitoring devices, one of the next steps is to visualize the data that XI collects while monitoring.
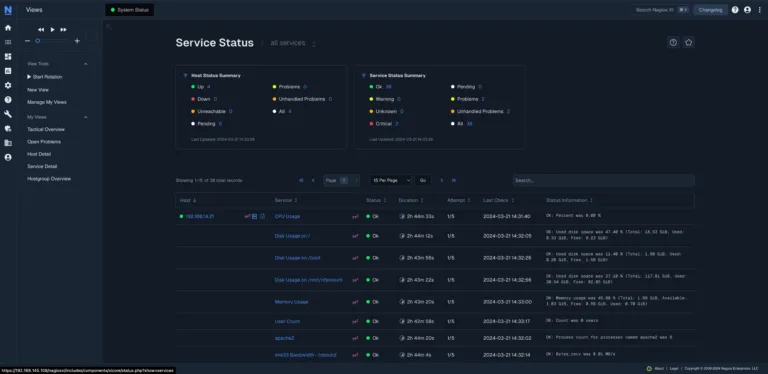
One of the out-of-the-box features in XI that allows you to view your most critical information is Views. The Views feature provides you with the ability to create multiple rotating displays of dashboards, tactical displays, and custom URLs, so you can have quick access to the most valuable data.
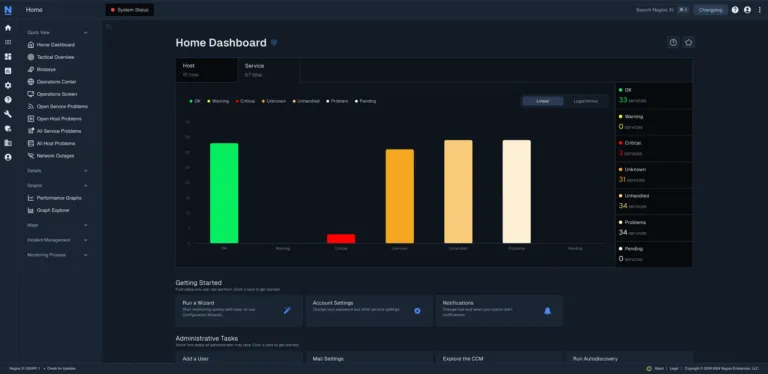
XI’s Dashboard feature is another useful out-of-the-box tool that allows you to easily view the status of your Hosts and Services and other important metrics all on one page. You can create these customized tactical displays using a variety of built-in dashlets, including graphs, status summaries, gauges, maps, and more to help decision makers better understand the true health of your network.
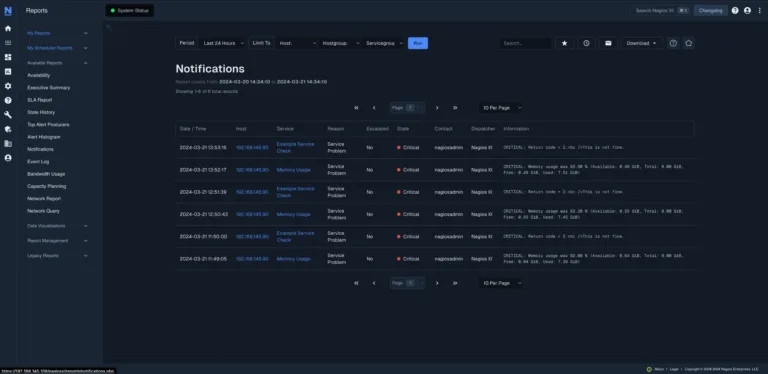
Another beneficial feature for giving decision makers insight into network health is XI’s reporting feature. The Standard Edition of XI comes with a variety of reports for visualizing data, including availability, executive summary, and state history reports. The Enterprise Edition of XI comes with additional reporting features such as capacity planning and SLA reports, managed reports, and scheduled reports so you can gain deeper insight into your IT infrastructure and expedite the reporting process. Regardless of the edition you have, you can customize these reports to show you the data that is essential effective IT infrastructure management.
The Importance of Customizability in IT Monitoring Software
If you want your monitoring solution to give you a comprehensive view of your network, you cannot ignore the importance of customizability. Without this characteristic, your ability to monitor whatever you need to will be severely limited, and you’ll be unable to get a clear overall picture of how your network is performing.
XI gives you this necessary customization power through several out-of-the-box features to help you monitor many common devices and visualize your data. With the help of add-ons, you can go even further and monitor nearly anything to meet the requirements of your organization. That customizability can be the difference between overlooking an issue or resolving it before it has a chance to impact your IT infrastructure.