


Pricing that punishes growth.
Per-sensor pricing means every port, every metric, every interface has its own line item.
The Nagios Networking Toolkit delivers network device status monitoring, traffic visibility, and forensic log analysis in a connected workflow without service-based licensing or additional modules.
See how the Nagios Networking Toolkit fits your environment. Fill out the form below to get started.
Questions about pricing, licensing, or deployment? Fill out the form below to connect with our team about the Nagios Networking Toolkit.
Before a user reports it. XI monitors every switch, router, firewall, & server.
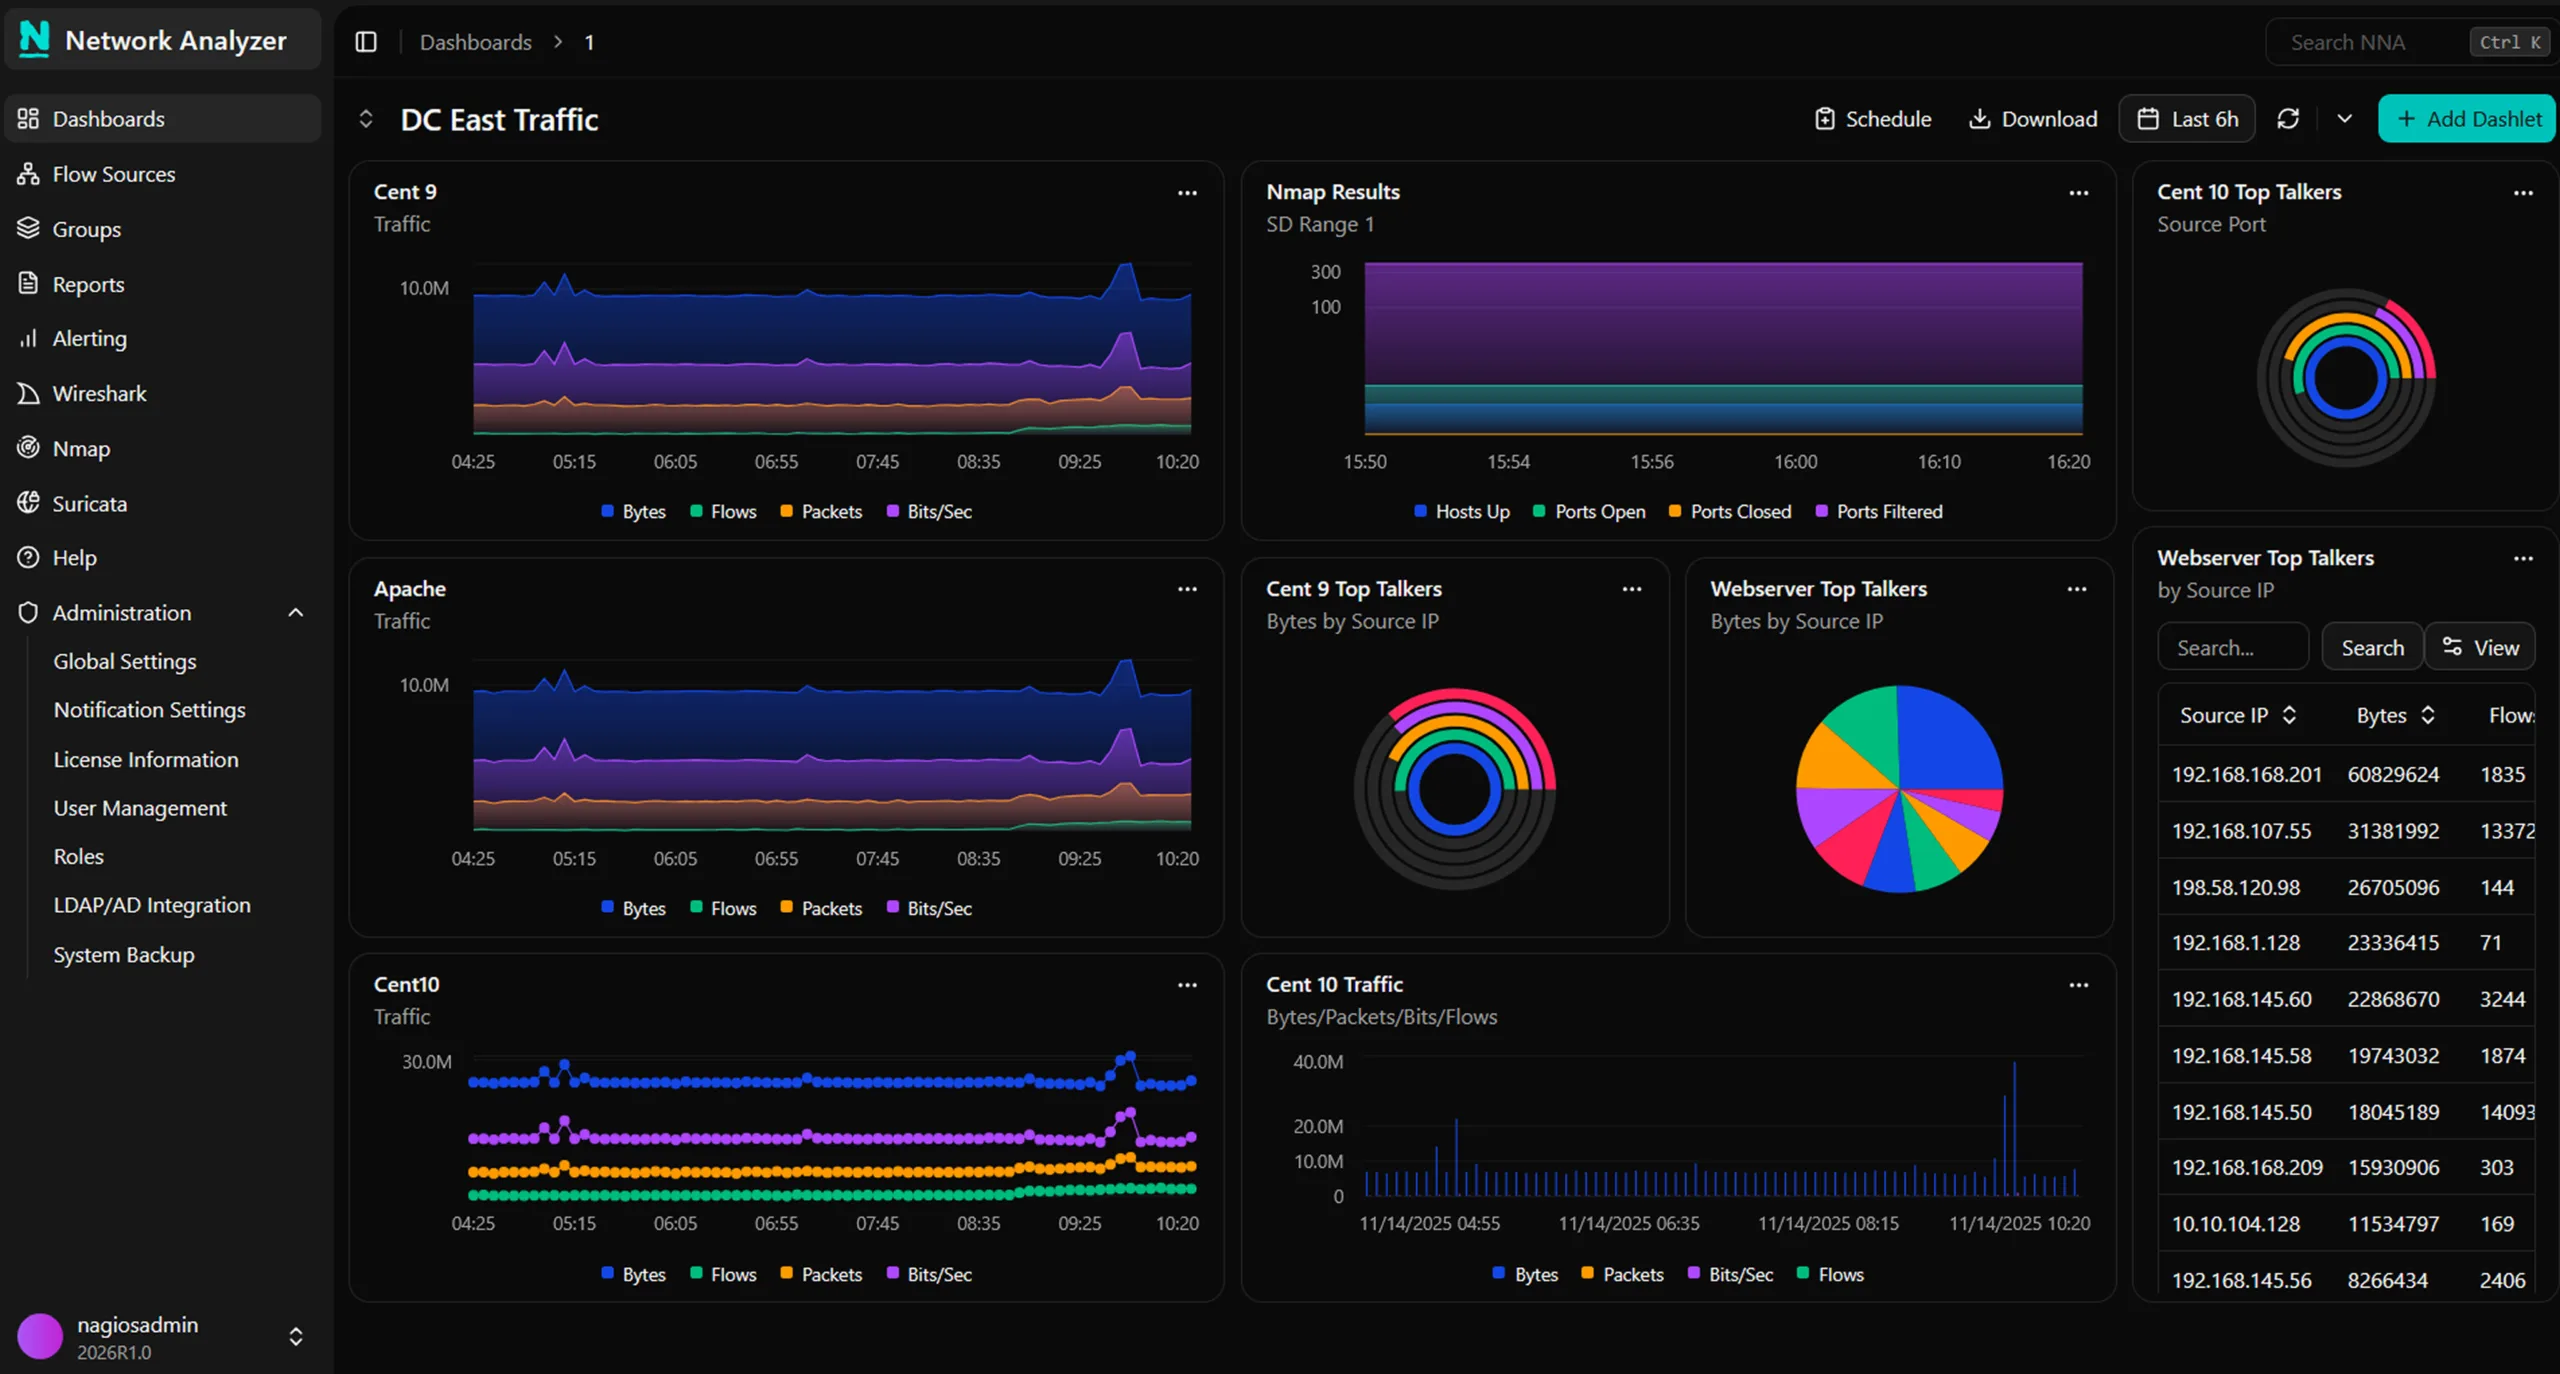
Collect NetFlow, sFlow, J-Flow, and IPFIX. No new hardware required.
Unified interface for Suricata, Wireshark, and Nmap once installed.
No per-sensor or per-module fees. Just predictable, scalable licensing.
You have Cisco switches, Meraki access points, Fortinet at the edge, and servers across multiple sites. You need uptime alerts, bandwidth visibility, and device discovery that doesn’t cost more every time your network grows.
Choose monitoring that stays reliable and in your control, not tied to subscriptions that can cut you off.
Per-sensor pricing means every port, every metric, every interface has its own line item.
Subscription-only licensing means you don't own the software. Miss a payment and it stops working.
You know it's up. You don't know who's consuming 80% of it, where it's going, or what changed at 2 AM.
Monitor network device health and status changes, analyze unusual traffic patterns, and centralize logs in one connected toolkit built for complete network visibility.
Device State Layer
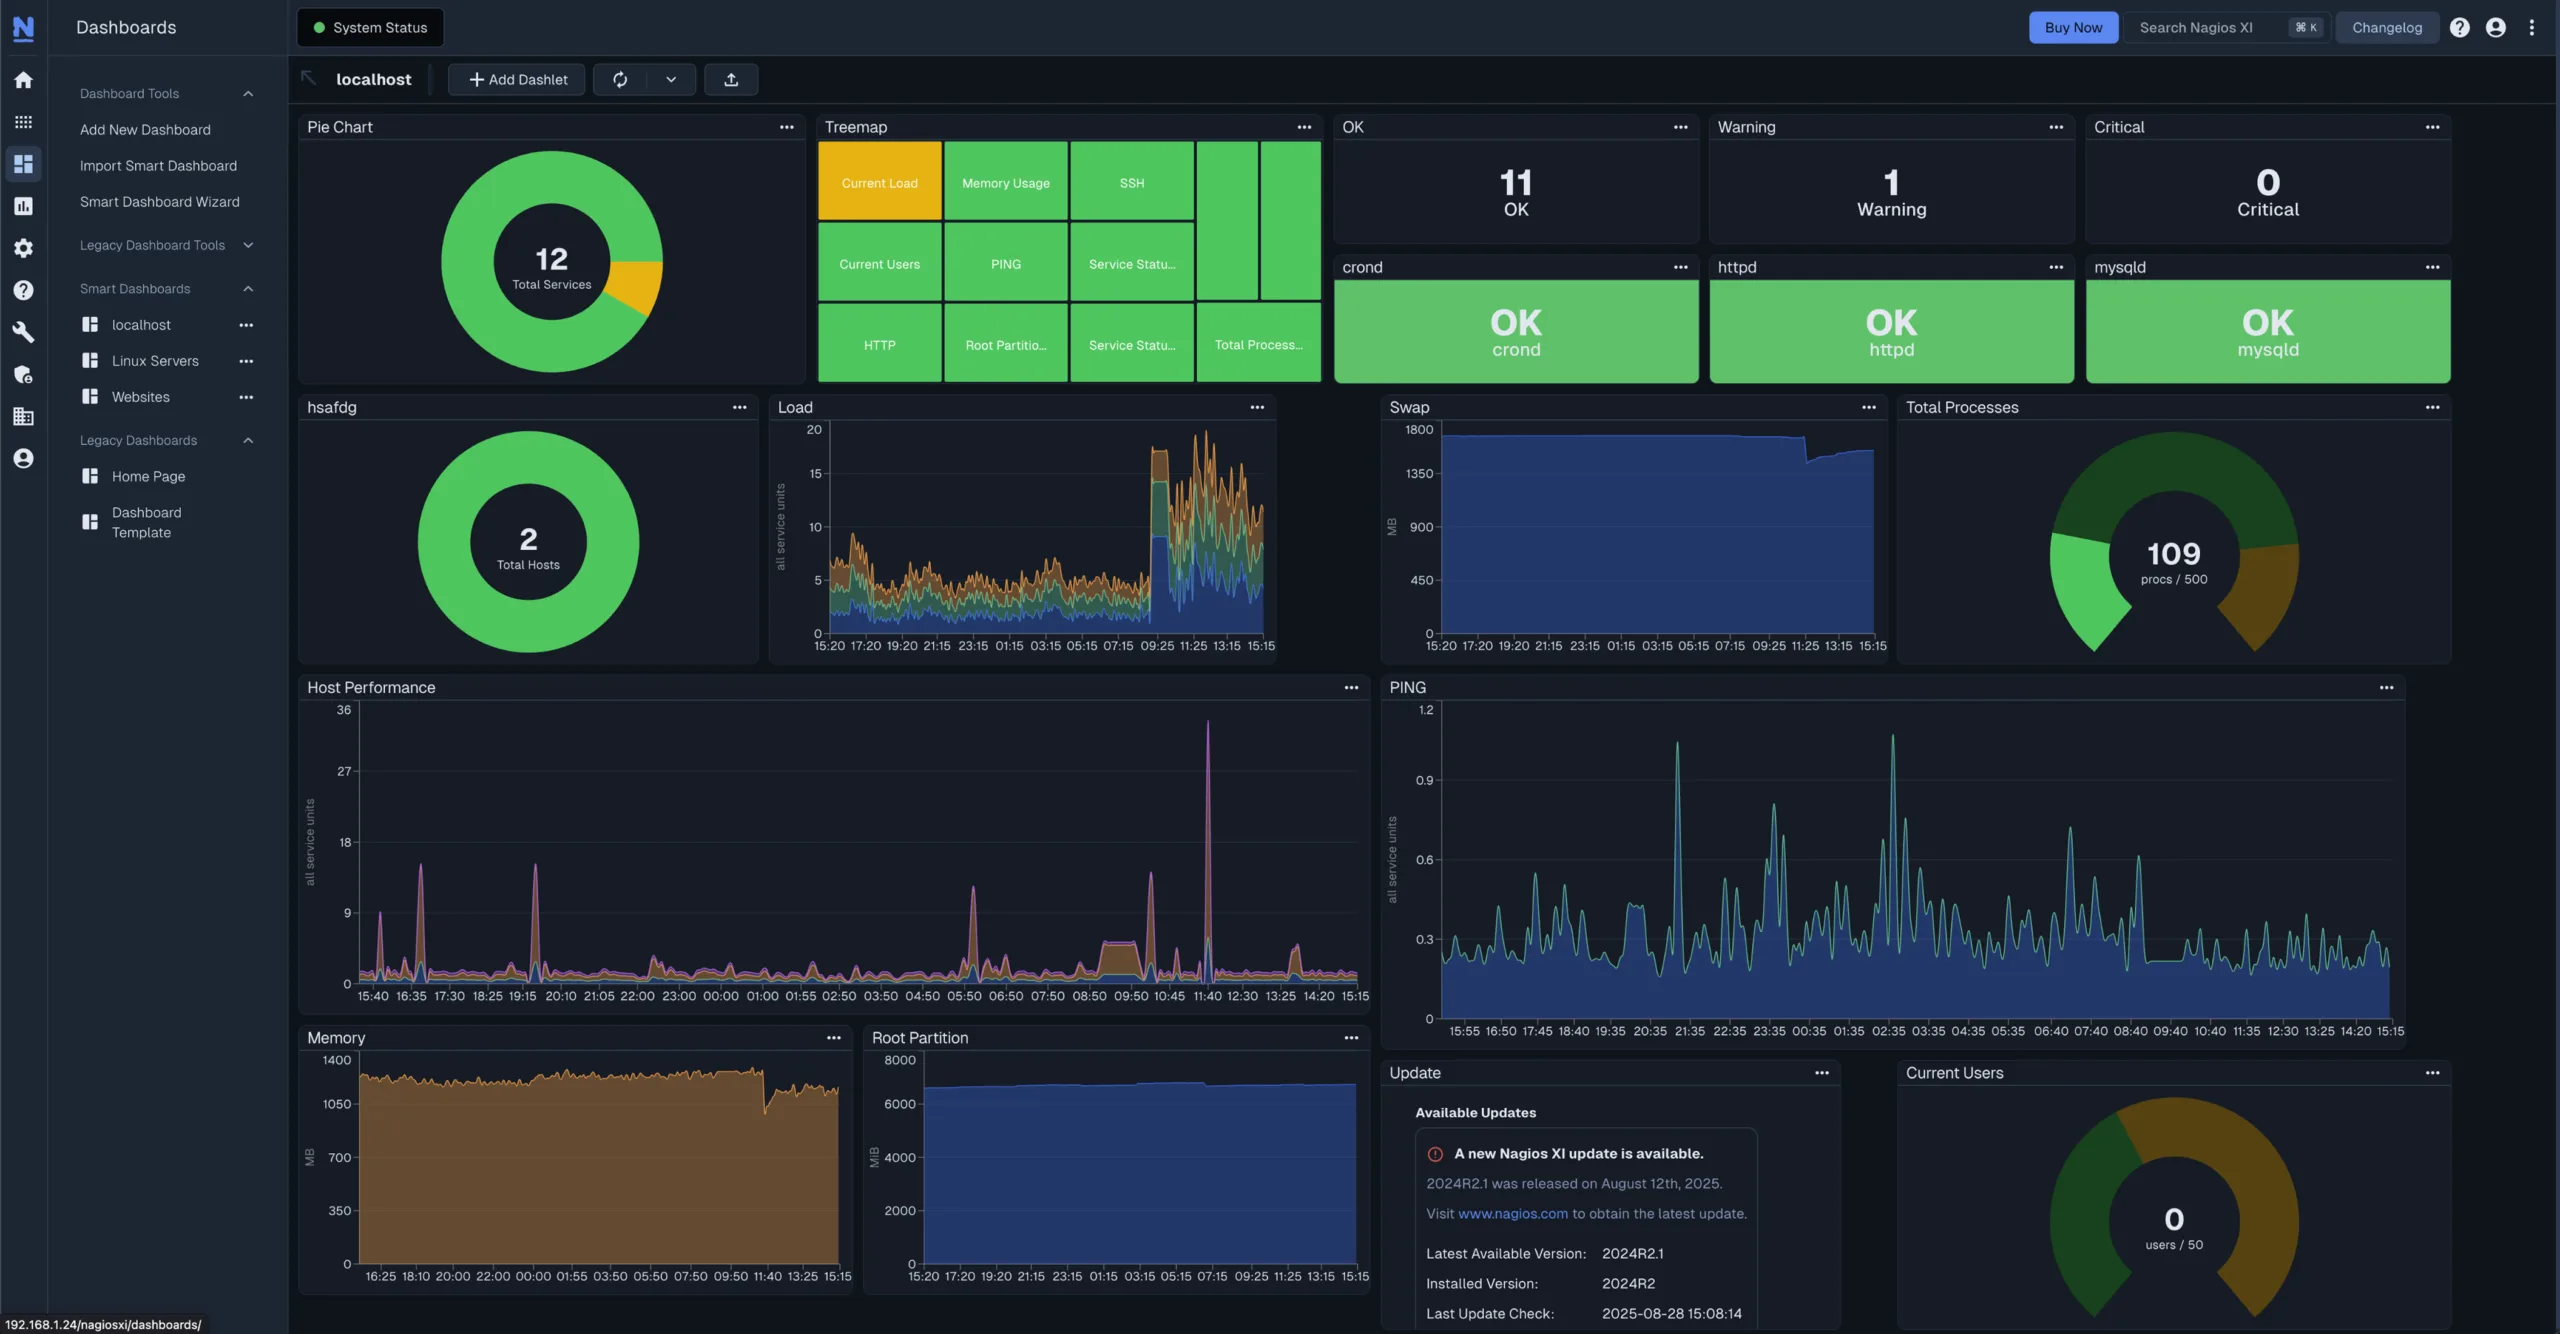
Know the moment something changes. Nagios XI monitors every switch, router, firewall, and server via SNMP. Interface status, service states, resource thresholds, SNMP traps. NCPA agent available for deeper host-level visibility on Linux and Windows.
Explore Nagios XITraffic & Analysis Layer
See what's moving across your network. Top talkers, bandwidth trends, protocol usage, and traffic patterns down to the individual flow. Collects NetFlow, sFlow, J-Flow, and IPFIX. Provides a unified interface for Suricata, Wireshark, and Nmap once installed.
Explore Network AnalyzerLog Collection Layer
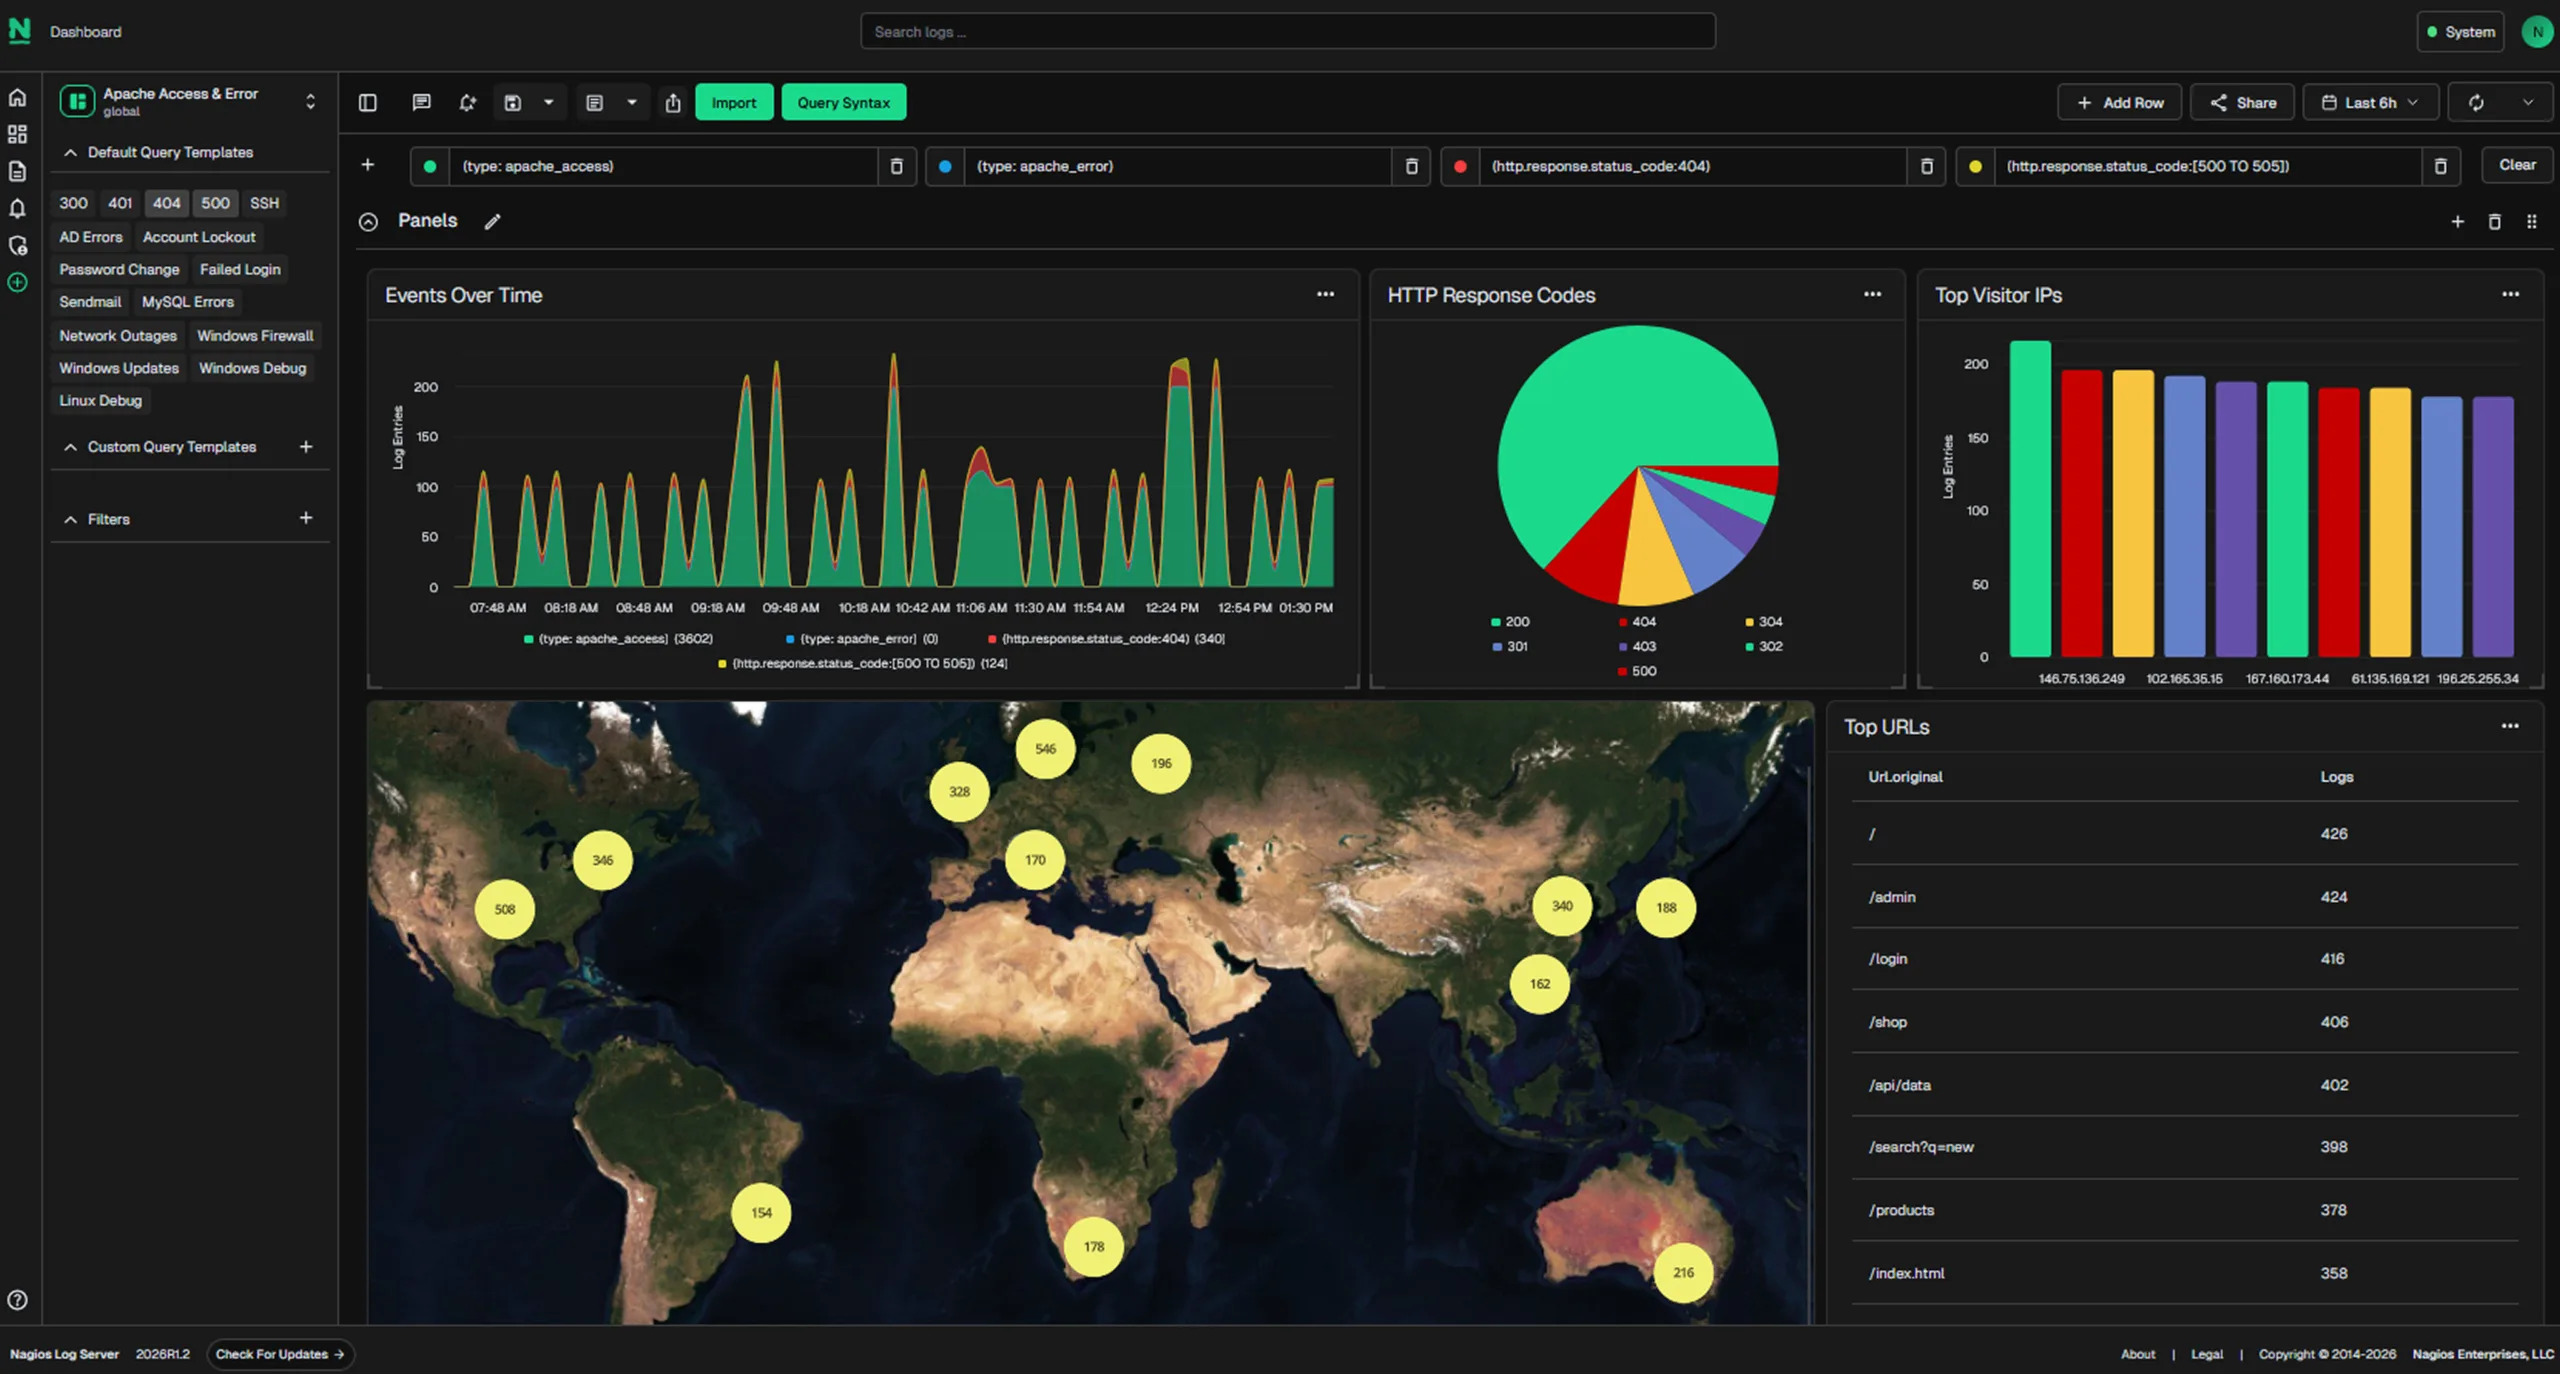
Add context when network events need investigation. Log Server consolidates syslog data from servers, firewalls, and network devices into a centralized, searchable repository. Surfaces authentication events, privilege changes, and service state changes alongside your network monitoring data.
Explore Log ServerDevice State Layer
Know the moment something changes. Nagios XI monitors every switch, router, firewall, and server via SNMP. Interface status, service states, resource thresholds, SNMP traps. NCPA agent available for deeper host-level visibility on Linux and Windows.
Explore Nagios XI →If your monitoring tool charges per sensor, element, or module, costs scale with your network. The Nagios Networking Toolkit lets you scale your network without increasing costs.
Your monitoring data never leaves your network, and your licensing comes with predictable pricing for peace of mind.
Your data stays on your servers. A hard requirement for healthcare, finance, and government compliance — and a sensible default for everyone else.
All Nagios licenses are perpetual and yours to keep. First-year Maintenance & Support is included at no additional cost, with optional annual renewal thereafter.
Your network, your protocols,SNMP, syslog, NetFlow v5, v7, v9, sFlow, J-Flow, and IPFIX. If your devices already send it, Nagios already reads it.
Designed for end-to-end network visibility and stable licensing.